


Similar Questions
Explore conceptually related problems
Recommended Questions
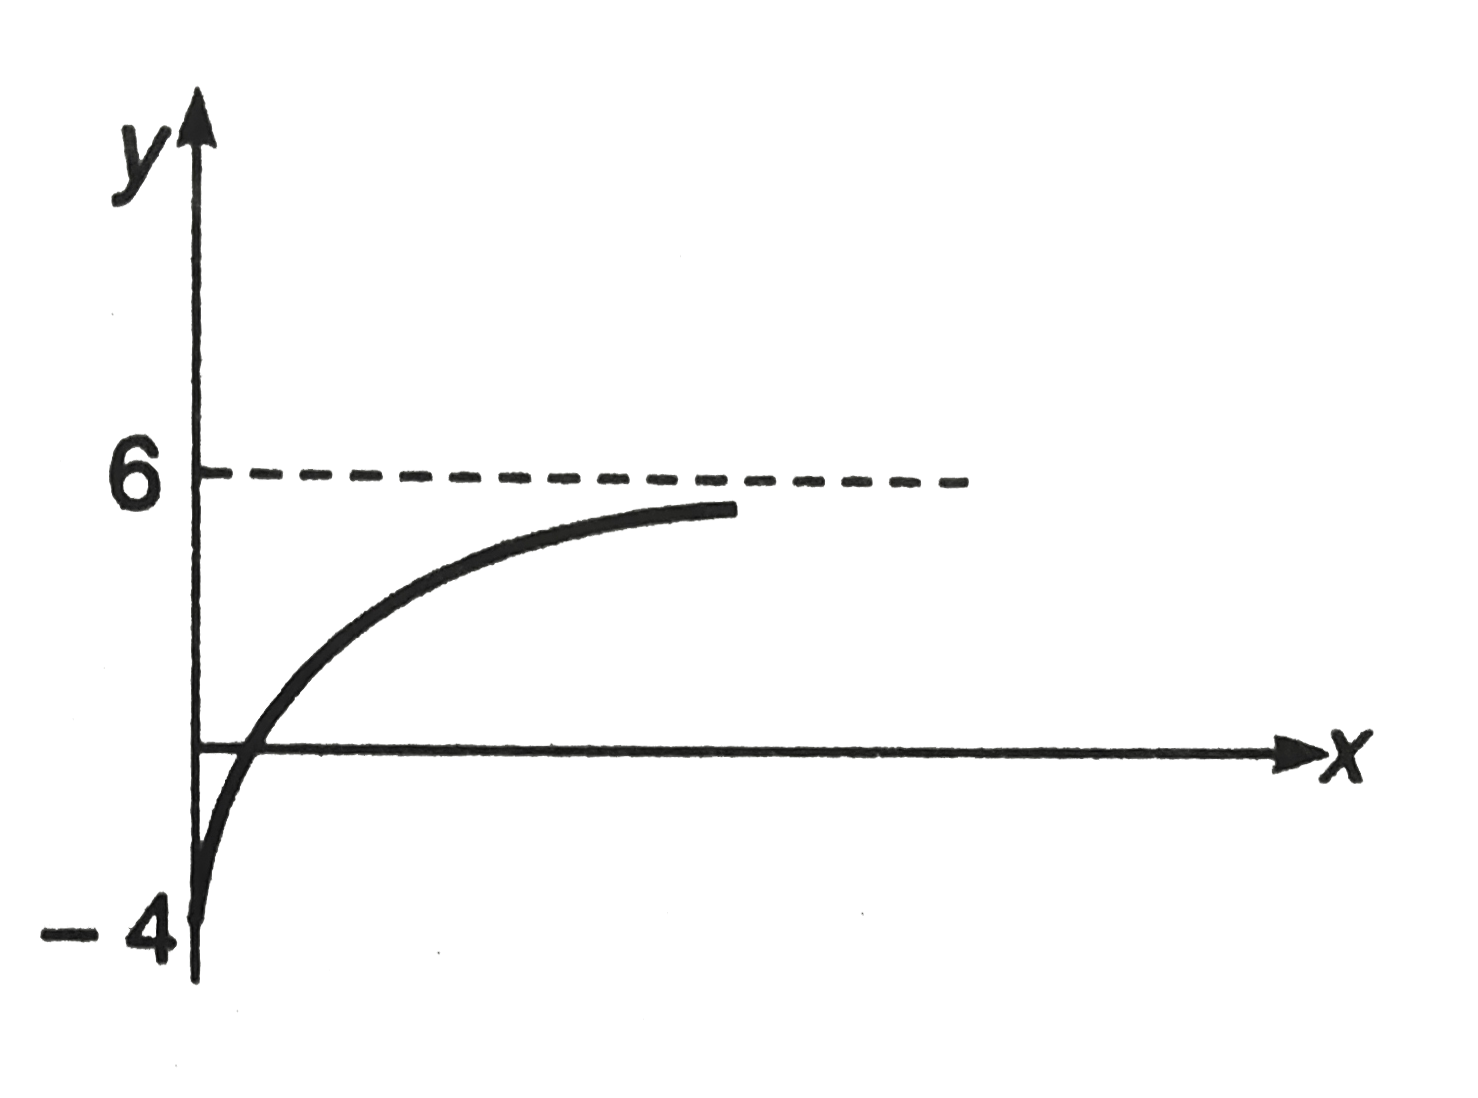
- The graph shows in figure is exponential. Write down the equation corr...
Text Solution
|
- For the graphs given below, write down their x -y equations
Text Solution
|
- The graph shown in figure is exponential. Write down the equation corr...
Text Solution
|
- The graph shows in figure is exponential. Write down the equation corr...
Text Solution
|
- In the given figure is shown a variable y varying exponentially on ano...
Text Solution
|
- Figure shows the acceleration-time graphs of a particle. Which of the ...
Text Solution
|
- In the figure represent cyclic process. The corresponding PV graph is
Text Solution
|
- बगल के चित्र में वेग - समय ग्राफ दर्शाया गया है। इस ग्राफ का संगत विस...
Text Solution
|
- Figure shows the acceleration time graph of a particle. Which of the f...
Text Solution
|