 .
.


Similar Questions
Explore conceptually related problems
Recommended Questions
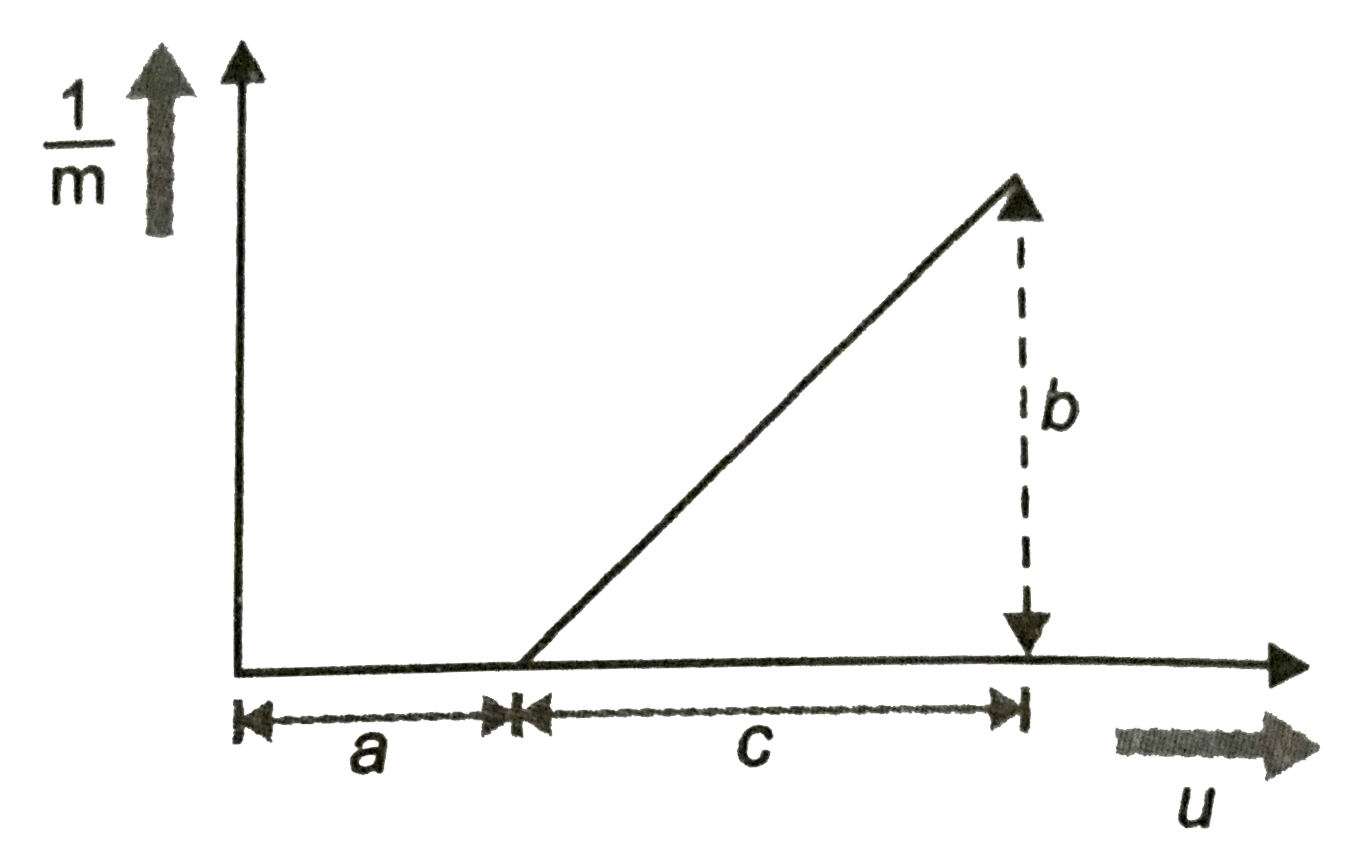
- The graph in Fig. shows how the inverse of magnification 1//m produced...
Text Solution
|
- The graph shows how the magnification m produced by a convex thin len...
Text Solution
|
- An object is placed at a distance of 1.5 m from a screen and a convex ...
Text Solution
|
- An object is placed at a distance of 1.5 m from a screen and a convex ...
Text Solution
|
- The graph in Fig. shows how the inverse of magnification 1//m produced...
Text Solution
|
- The graps shows the variation of magnification m produced by as convex...
Text Solution
|
- The graph shows how the magnification m produced by a thin lens varies...
Text Solution
|
- A convex lens is used to obtain a magnified image of an object on a sc...
Text Solution
|
- An object is placed at a distance of 1.5 m from a screen and a convex ...
Text Solution
|