Home
Class 11
PHYSICS
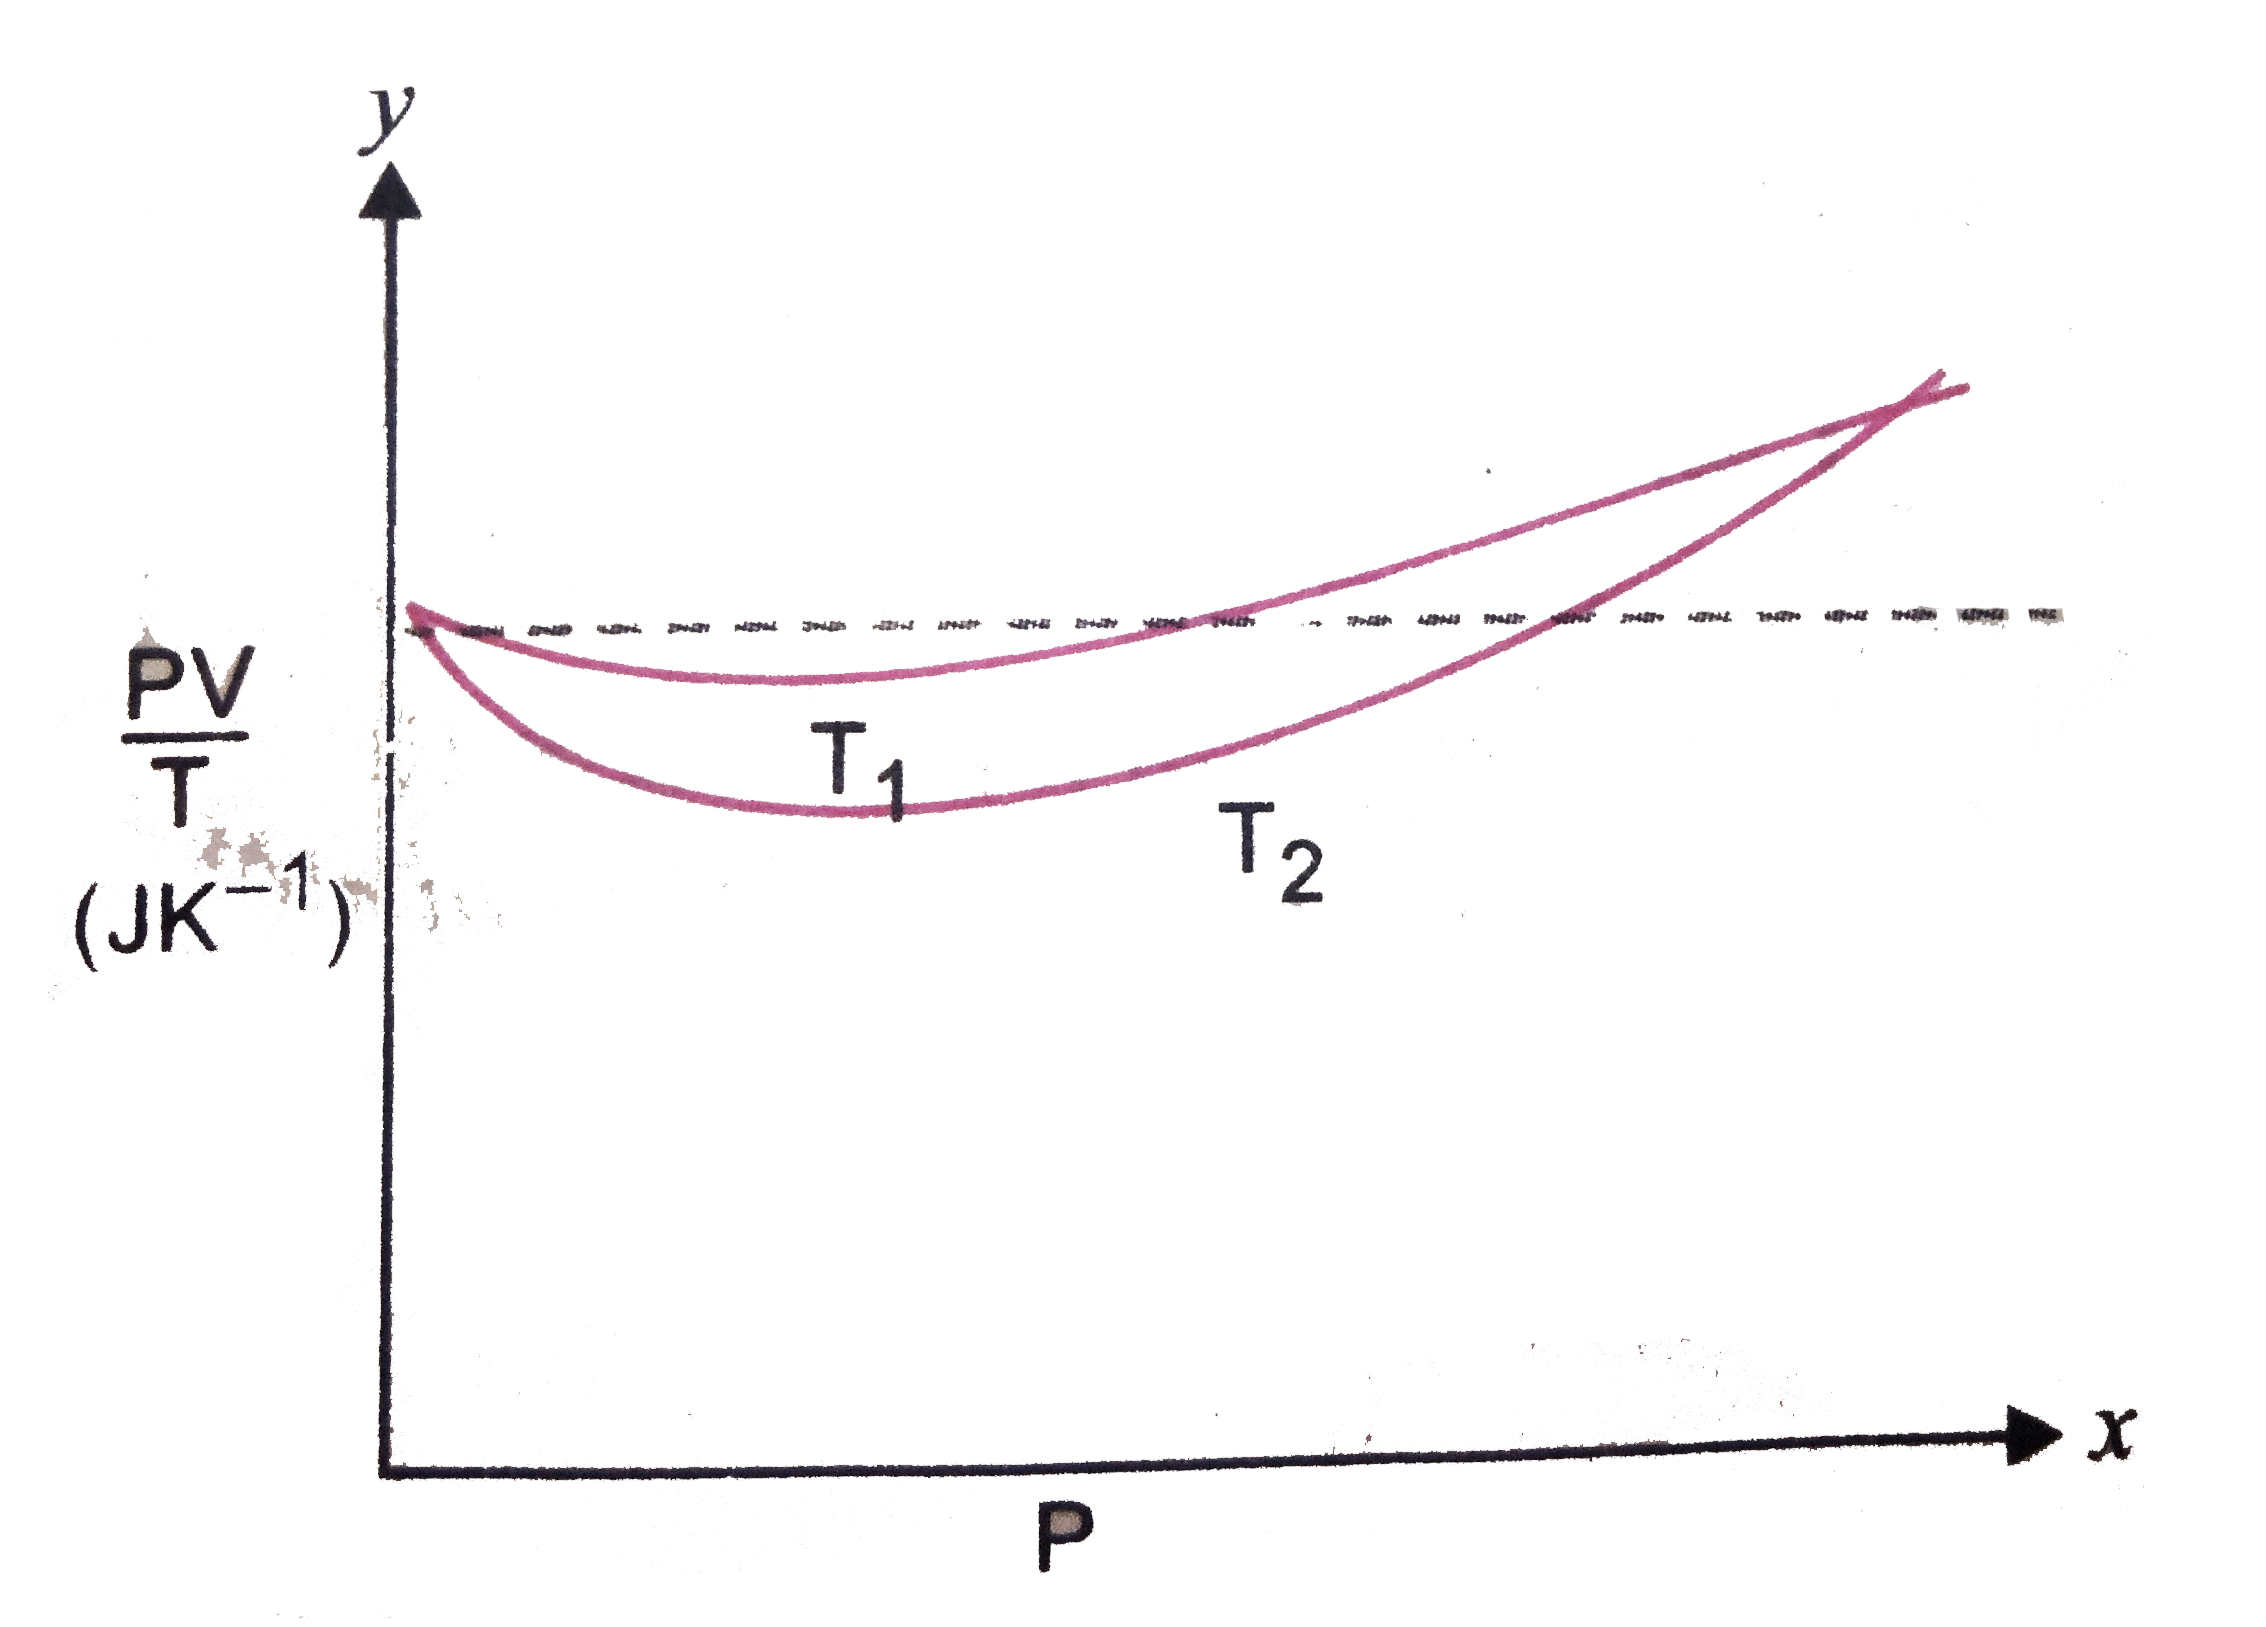
Fig shows of PV//T versus P for 1.00 xx ...

Fig shows of `PV//T` versus P for `1.00 xx 10^(-3) kg` of oxygen gas at two different temperatures.
(a) What does the dotted plot signify ?
(b) Which is true : `T_(1) lt T_(2) or T_(2) lt T_(1) ?`
( c) What is the value of `PV//T` where the curves meet on the Y-axis ?
(d) If we obtained similar plot for `1.00 xx 10^(-3) kg` of hydrogen, would we get the same value of `PV//T` at the point where the curves meet on the y-axis ? If not, what mass of hydrogen yield the same value of `PV//T` (for low pressure high temperature region of the plot) ? (Molecular mass of `H = 2.02 u`, of `O = 32.0 u, R = 8.31 J "mol"^(-1) K^(-1)`

Promotional Banner

Similar Questions

Explore conceptually related problems

Figure Show plot of PV//T versus P for 1.00xx10^(-3) kg of oxygen gas at two different temperatures. (a) What does the dotted plot signify? (b) Which is true: T_(1) gt T_(2) or T_(1) lt T_(2) ? (c) What is the value of PV//T where the curves meet on the y-axis? (d) If we obtained similar plots for 1.00xx10^(-3) kg of hydrogen, would we get the same value of PV//T at the point where the curves meet on the y-axis? If not, what mass of hydrogen yields the same value of PV//T (for low pressure high temperature region of the plot) ? (Molecular mass of H_(2) = 2.02 u, of O_(2) = 32.0 u, R= 8.31Jmol^(-1)K^(-1).)

Figure Show plot of PV//T versus P for 1.00xx10^(-3) kg of oxygen gas at two different temperatures. (a) What does the dotted plot signify? (b) Which is true: T_(1) gt T_(2) or T_(1) lt T_(2) ? (c) What is the value of PV//T where the curves meet on the y-axis? (d) If we obtained similar plots for 1.00xx10^(-3) kg of hydrogen, would we get the same value of PV//T at the point where the curves meet on the y-axis? If not, what mass of hydrogen yields the same value of PV//T (for low pressure high temperature region of the plot) ? (Molecular mass of H_(2) = 2.02 u, of O_(2) = 32.0 u, R= 8.31Jmol^(-1)K^(-1).)

Figure shows plot of PV//T versus P"for" 1.00 xx 10^(-3) kg of oxygen gas at two different temperatures. (i) What does the dotted plot signify? (ii) Which is true . T_(1) gt T_(2) "or" T_(1) lt T_(2) ? (iii) What is the value of PV//T where the curves meet on the y-axis?

Figure shows plot of PV//T versus P"for" 1.00 xx 10^(-3) kg of oxygen gas at two different temperatures. (i) What does the dotted plot signify? (ii) Which is true . T_(1) gt T_(2) "or" T_(1) lt T_(2) ? (iii) What is the value of PV//T where the curves meet on the y-axis?

Figure 13.8 shows plot of PV//T versus P for l.OOxxlO^-3 kg of oxygen gas at two different temperatures. What does the dotted plot signif?:

Figure 13.8 shows plot of PV//T versus P for l.OOxxlO^-3 kg of oxygen gas at two different temperatures.Which is true: T_1 > T_2 or T_1

Figure 13.8 shows plot of PV//T versus P for l.OOxxlO^-3 kg of oxygen gas at two different temperatures What is the value of PV/Twhere the curves meet on the y-axis? :