


Similar Questions
Explore conceptually related problems
Recommended Questions
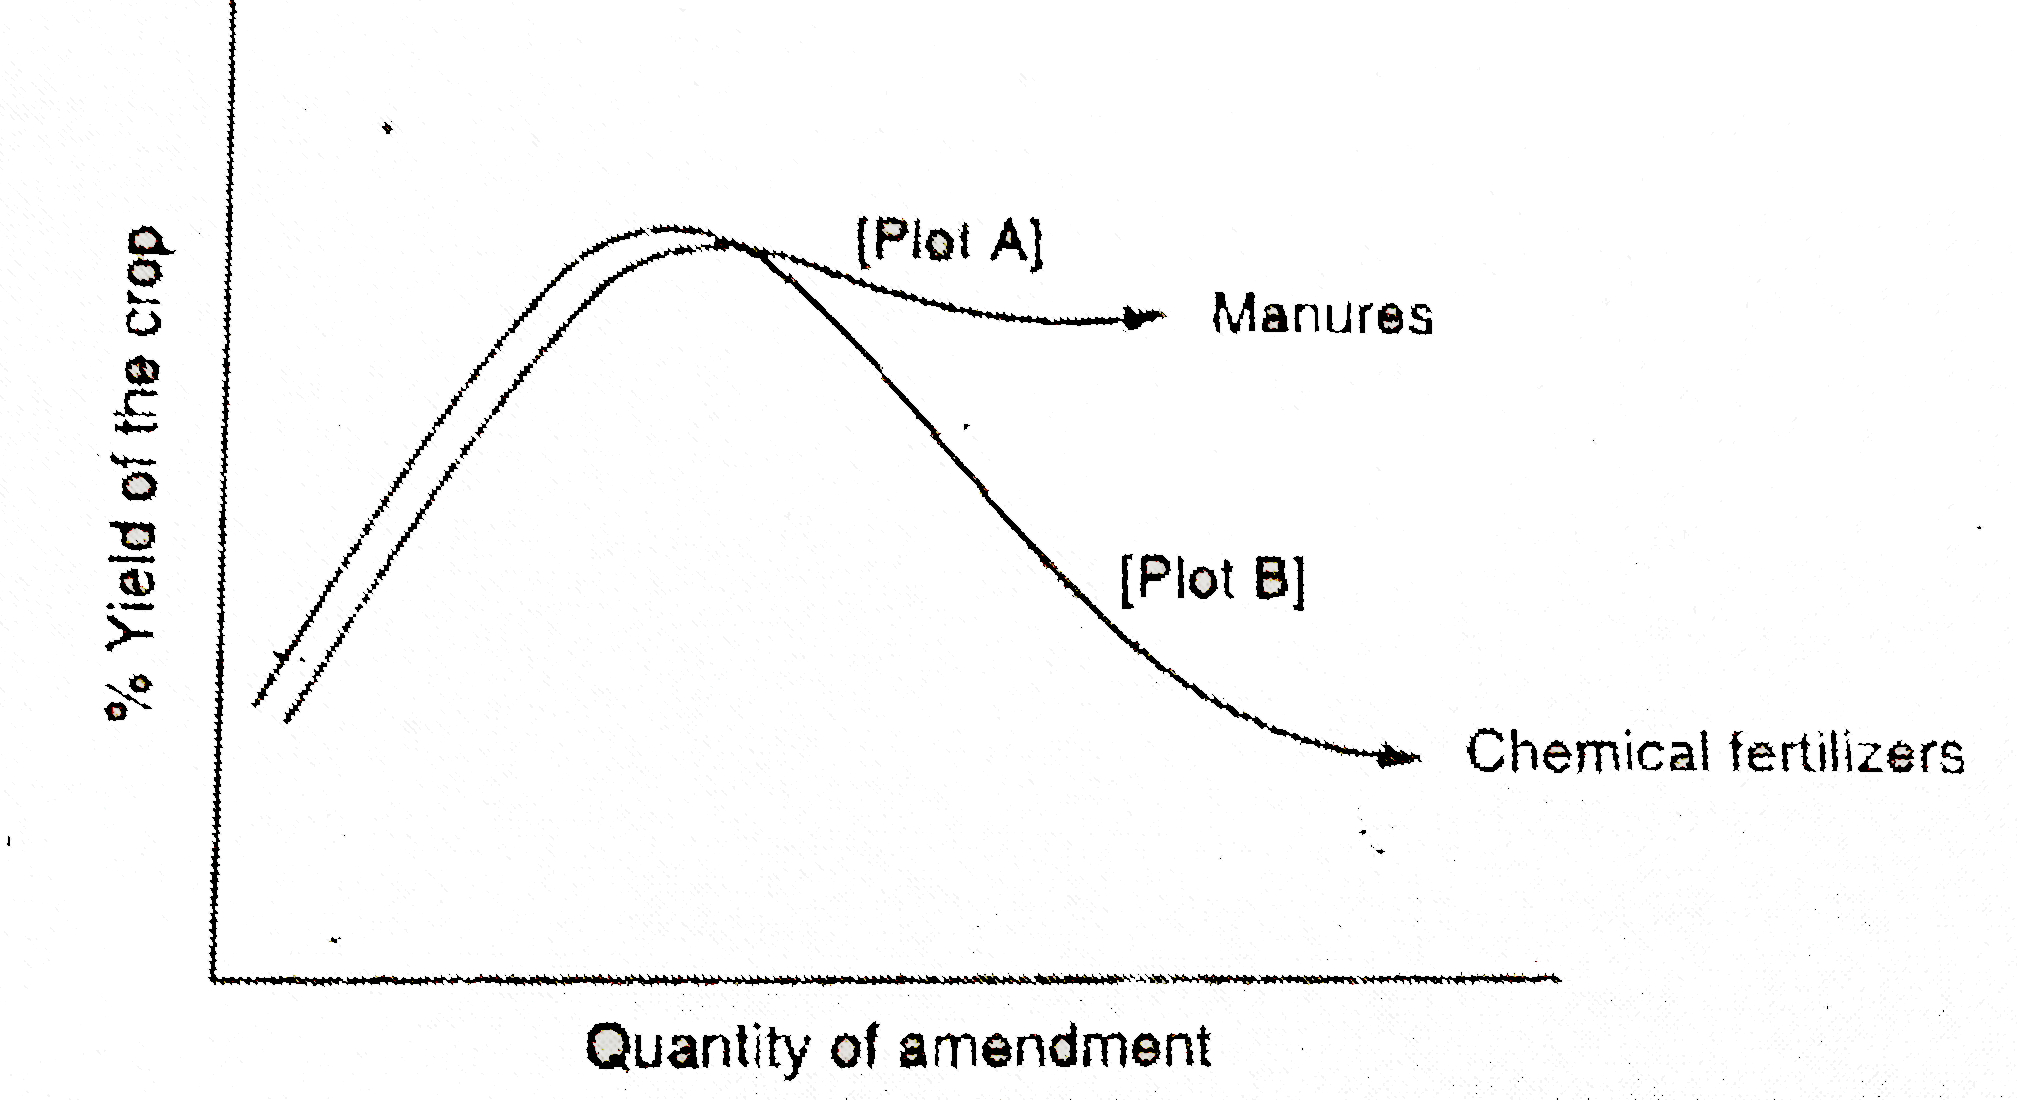
- The figure shows two crop fields (plots A and B) have been treated by ...
Text Solution
|
- बार ग्राफ का अध्ययन कीजिए और निम्नलिखित प्रश्नों के उत्तर दीजिए। ग्राफ...
Text Solution
|
- बार ग्राफ का अध्ययन कीजिए और निम्नलिखित प्रश्नों के उत्तर दीजिए। ग्राफ...
Text Solution
|
- Figure shows the two crop fields [Plots A and B ] have been treated by...
Text Solution
|
- The figure shows two crop fields (plots A and B) have been treated by ...
Text Solution
|
- The Arrhenius plots of two reactions, I and II are shown graphically- ...
Text Solution
|
- For a general reaction A to B, plot of concentration of A vs time ...
Text Solution
|
- Given below is a bar graph showing the heights of five mountain peaks ...
Text Solution
|
- तरंगदैर्घ्य के साथ लेंस कि शक्ति में परिवर्तन प्रदर्शित करने वाला...
Text Solution
|