Home
Class 12
PHYSICS
चित्र 6.4-5 में दिए गए परिपथ द्वारा किय...

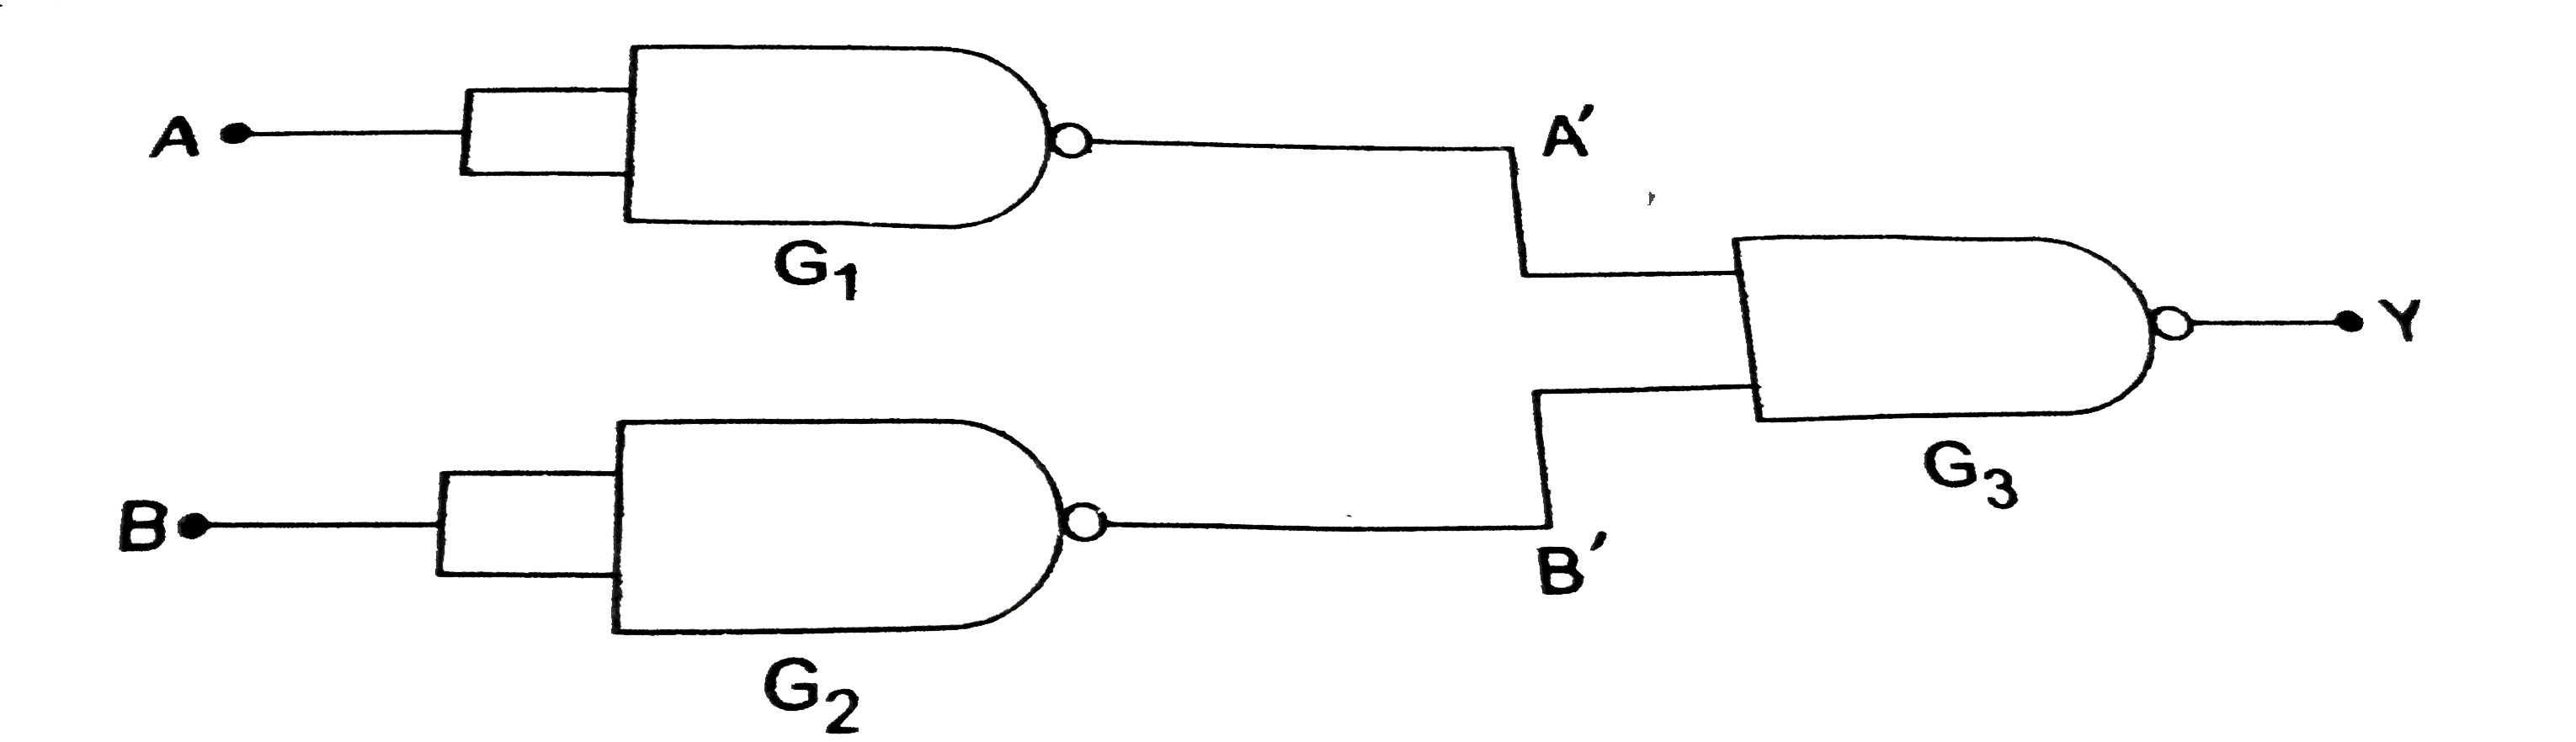
चित्र 6.4-5 में दिए गए परिपथ द्वारा किये गए तर्क क्रियाओ ( logic operation) की पहचान करे ।

Promotional Banner

Similar Questions

Explore conceptually related problems

The given bar graph presents the number of different types of vehicles (in lakhs) exported by a company during 2014 and 2015. दिया गया दंड आरेख एक कंपनी के द्वारा 2014 और 2015 में निर्यात किये गए अलग-अलग प्रकार के वाहनों की संख्या ( लाख में ) को दर्शाता है | The average number of type A, B and D vehicles exported in 2015 was x% less than the number of type E vehicles exported in 2014. What is the value of x? 2015 में निर्यात किये गए A, B और D प्रकार के वाहनों की औसत संख्या 2014 में निर्यात किये गए E प्रकार के वाहनों की संख्या से x% कम थी | x का मान क्या है ?

The given pie Chart (angles are not as per chosen scale) presents the marks scored by Amit in five subjects. Maximum marks in each subject = 100 Total score of Amit = 450 दिया गया वृत्त-आरेख ( कोण किसी चयनित पैमाने के अनुसार नहीं हैं ) पांच विषयों में अमित के द्वारा प्राप्त किये गए अंकों को दर्शाता है | प्रत्येक विषय के अधिकतम अंक = 100 अमित का कुल प्राप्तांक =450 The total marks scored by Amit in English and S. Studies is what percent (correct to one decimal place) more than the marks scored by him in Maths? अमित के द्वारा अंग्रेजी और सामाजिक विज्ञान में प्राप्त किये गए कुल अंक उसके द्वारा गणित में प्राप्त किये गए अंकों से कितना प्रतिशत अधिक हैं ? ( एक दशमलव स्थान तक )

The given pie Chart (angles are not as per chosen scale) presents the marks scored by Amit in five subjects. Maximum marks in each subject = 100 Total score of Amit = 450 दिया गया वृत्त-आरेख ( कोण किसी चयनित पैमाने के अनुसार नहीं हैं ) पांच विषयों में अमित के द्वारा प्राप्त किये गए अंकों को दर्शाता है | प्रत्येक विषय के अधिकतम अंक = 100 अमित का कुल प्राप्तांक =450 What is the difference between the marks scored by Amit in Hindi and Maths? अमित के द्वारा हिंदी और गणित में प्राप्त किये गए अंकों में क्या अंतर है?

The given table represents the number of engineers recruited by four companies A,B,C and D over the years. Study the table carefully and answer the questions that follows: The number of years in which the number of engineers recruited by company D is less than the average number of engineers recruited by company B in the given six years, is: दी गयी तालिका चार कंपनियों A, B, C और D के द्वारा इन वर्षों के दौरान भर्ती किये गए इंजीनियरों की संख्या दर्शाती है | इस तालिका का ध्यानपूर्वक अध्ययन करें तथा इसके बाद पूछे गए प्रश्न का उत्तर दें | ऐसे कितने वर्ष हैं जिनमें कंपनी D के द्वारा भर्ती किये गए इंजीनियरों की संख्या दिए गए छः वर्षों की अवधि में कंपनी B के द्वारा भर्ती किये गए इंजीनियरों की औसत संख्या से कम है?