


Similar Questions
Explore conceptually related problems
Recommended Questions
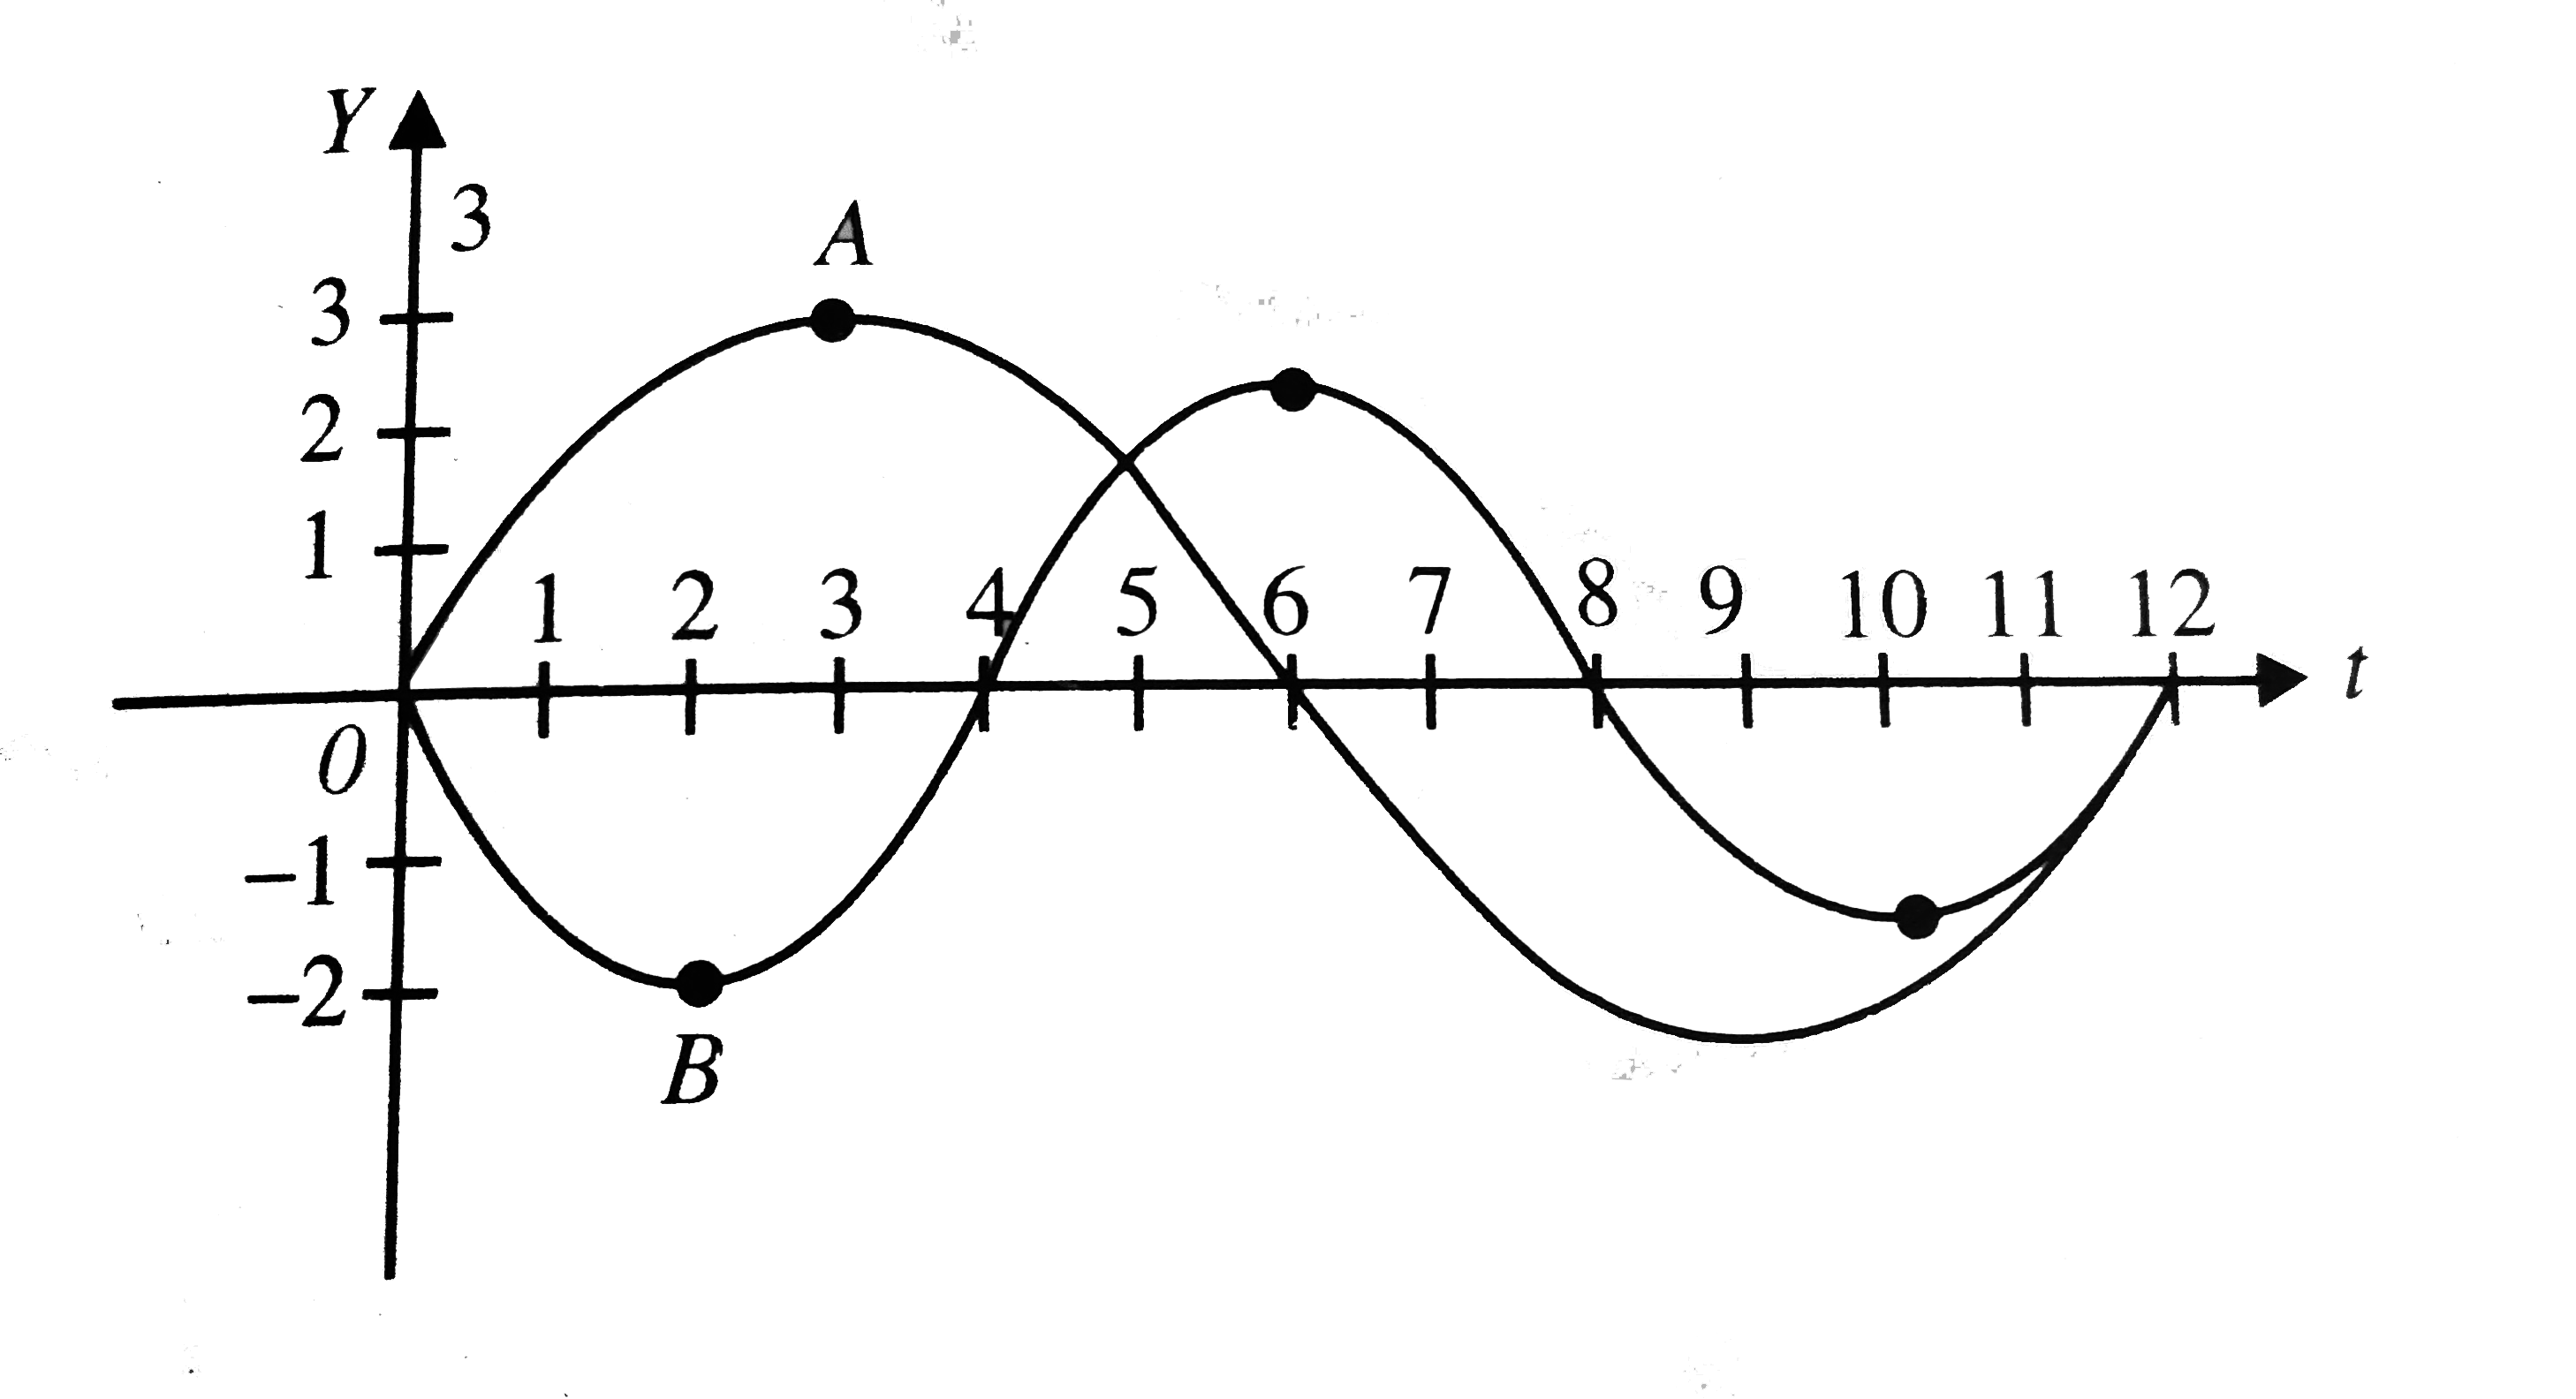
- The displacement vs time graph for two waves A and B which travel alon...
Text Solution
|
- The displacement vs time graph for two waves A and B which travel alon...
Text Solution
|
- The displacement time graph for two sound waves A and B are shown in t...
Text Solution
|
- Depedence is disturbances due to two waves on time is shown in the fig...
Text Solution
|
- The displacement-time graphs for two sound waves A and 5 are shown in ...
Text Solution
|
- Dependence of disturbances due to two waves on time is shown in the fi...
Text Solution
|
- The transversal displacement Vs time graph for two waves A and B which...
Text Solution
|
- If the two light wave have different amplitude, then show that intensi...
Text Solution
|
- The displacement vs time graph for two waves A and B which travel alon...
Text Solution
|