


Similar Questions
Explore conceptually related problems
Recommended Questions
- In a photoelectric experiment, the graph of frequency v of incident li...
Text Solution
|
- The stopping potential V for photoelectric emission from a metal surfa...
Text Solution
|
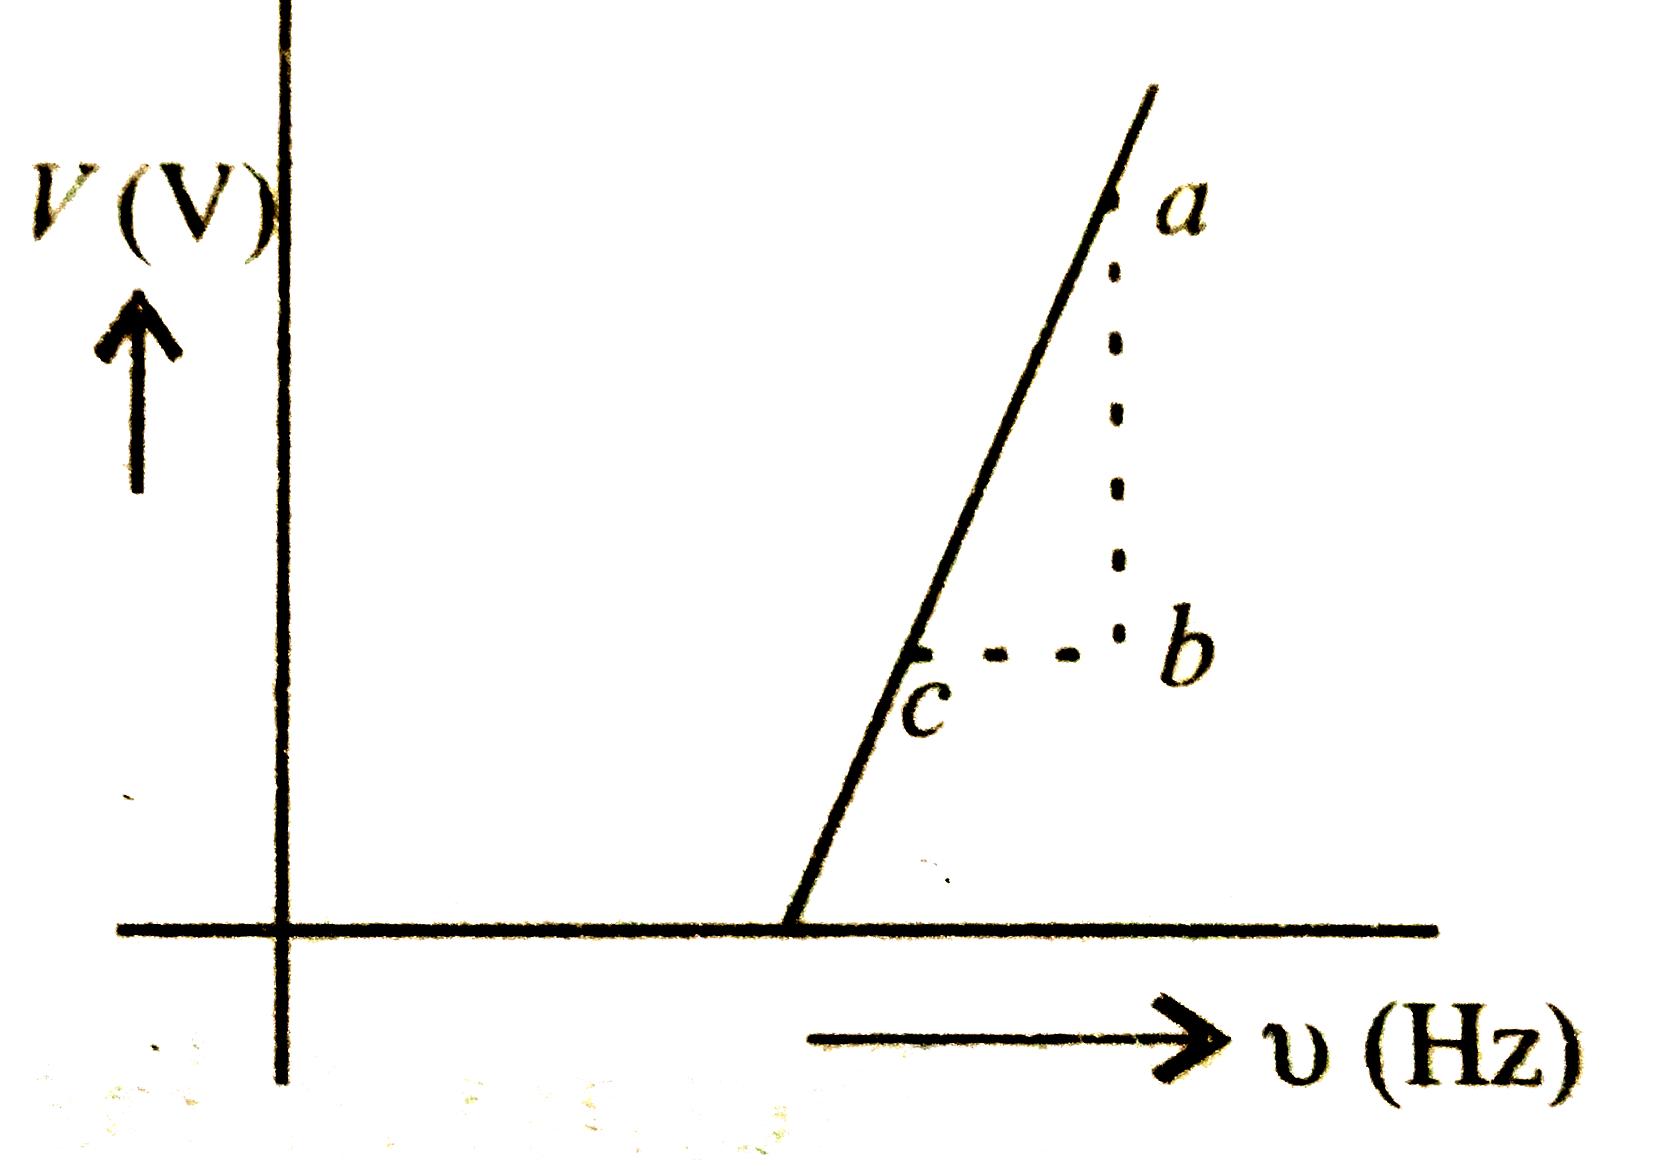
- From the graph shown, the value of work function if the stopping poten...
Text Solution
|
- In a photoelectric experiment, the graph of frequency v of incident li...
Text Solution
|
- In a photoelectric experiment the relation between applied potential d...
Text Solution
|
- In photoelectric effect the slope of straight line graph between stopp...
Text Solution
|
- In an experiment on the photoelectric effect , the slope of the cut - ...
Text Solution
|
- In a photoelectric effect experiment, the graph of stopping potential ...
Text Solution
|
- In an experiment on photoelectric effect, the slope of the cut-off vol...
Text Solution
|