


Similar Questions
Explore conceptually related problems
Recommended Questions
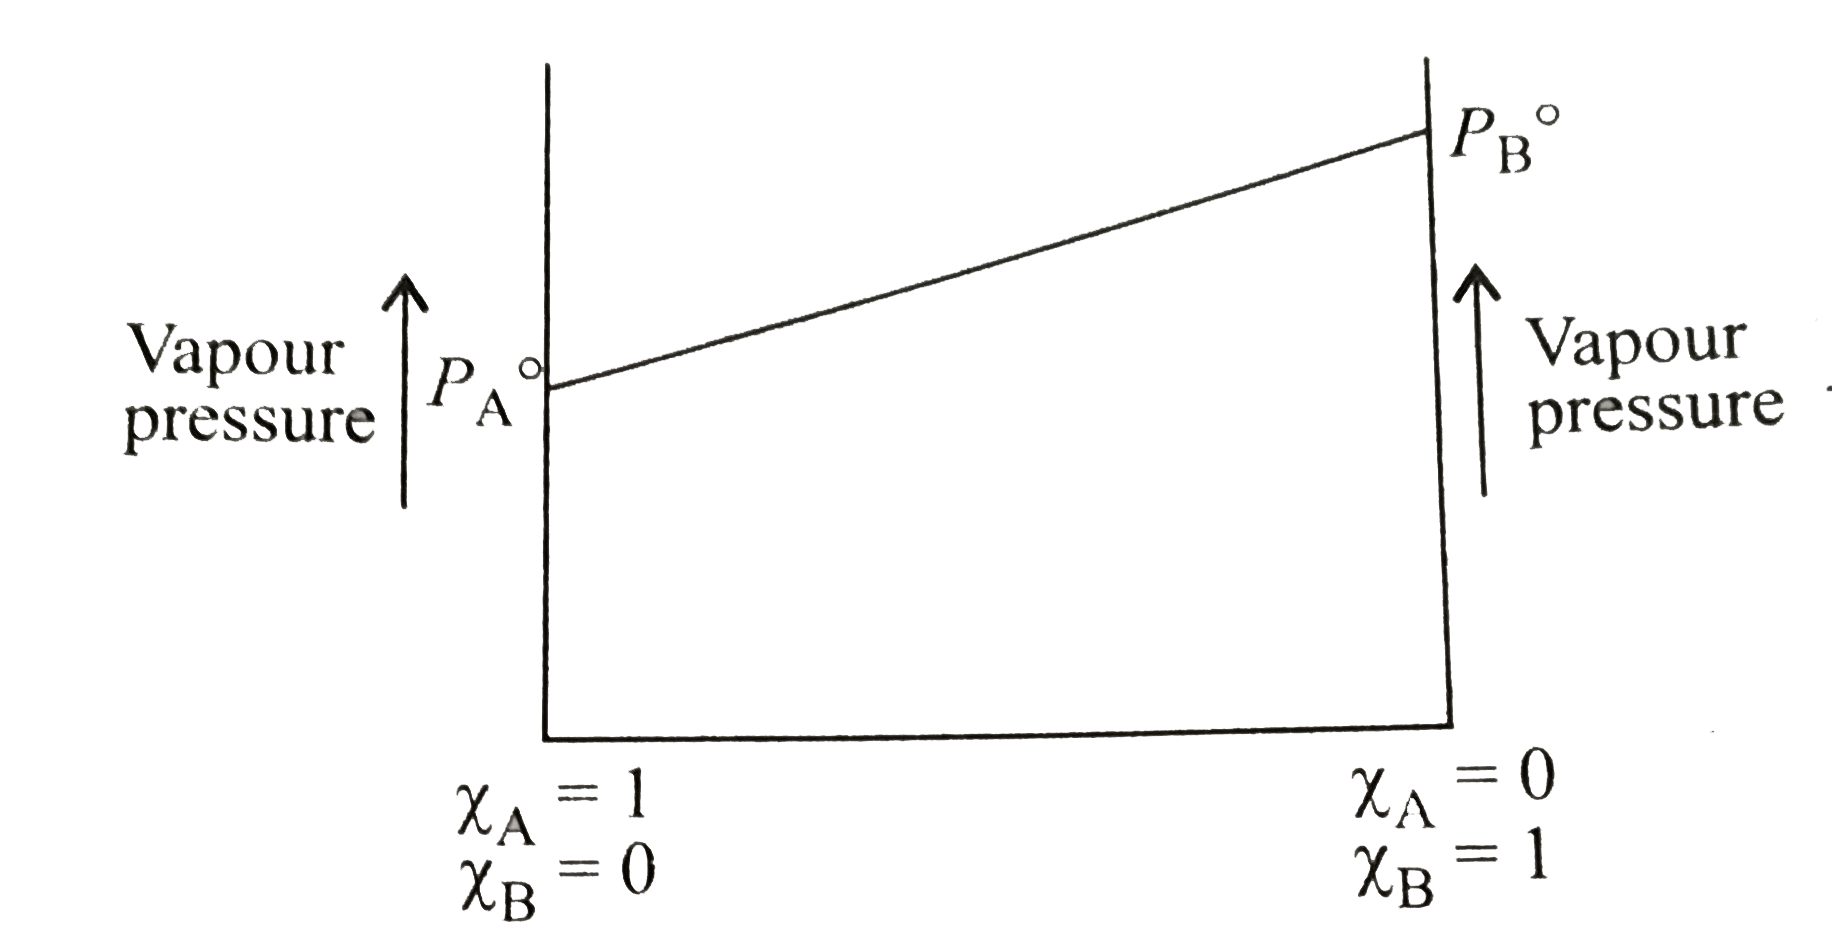
- The following is a graph plotted between the vapour pressure of two vo...
Text Solution
|
- The following is a graph plotted between the vapour pressure of two vo...
Text Solution
|
- A graph is plotted between the vapour pressure and mole fraction of a ...
Text Solution
|
- The following graph represents variation of boiling point with composi...
Text Solution
|
- The following graph represents variation of vapour pressre with compos...
Text Solution
|
- Derive the relationship between relative lowering of vapour pressure a...
Text Solution
|
- Vapour pressure diagram of some liquids plotted against temperature ar...
Text Solution
|
- Derive the relationship between relative lowering of vapour pressure a...
Text Solution
|
- Derive an equation for solution which shows relation between total pre...
Text Solution
|