


Similar Questions
Explore conceptually related problems
Recommended Questions
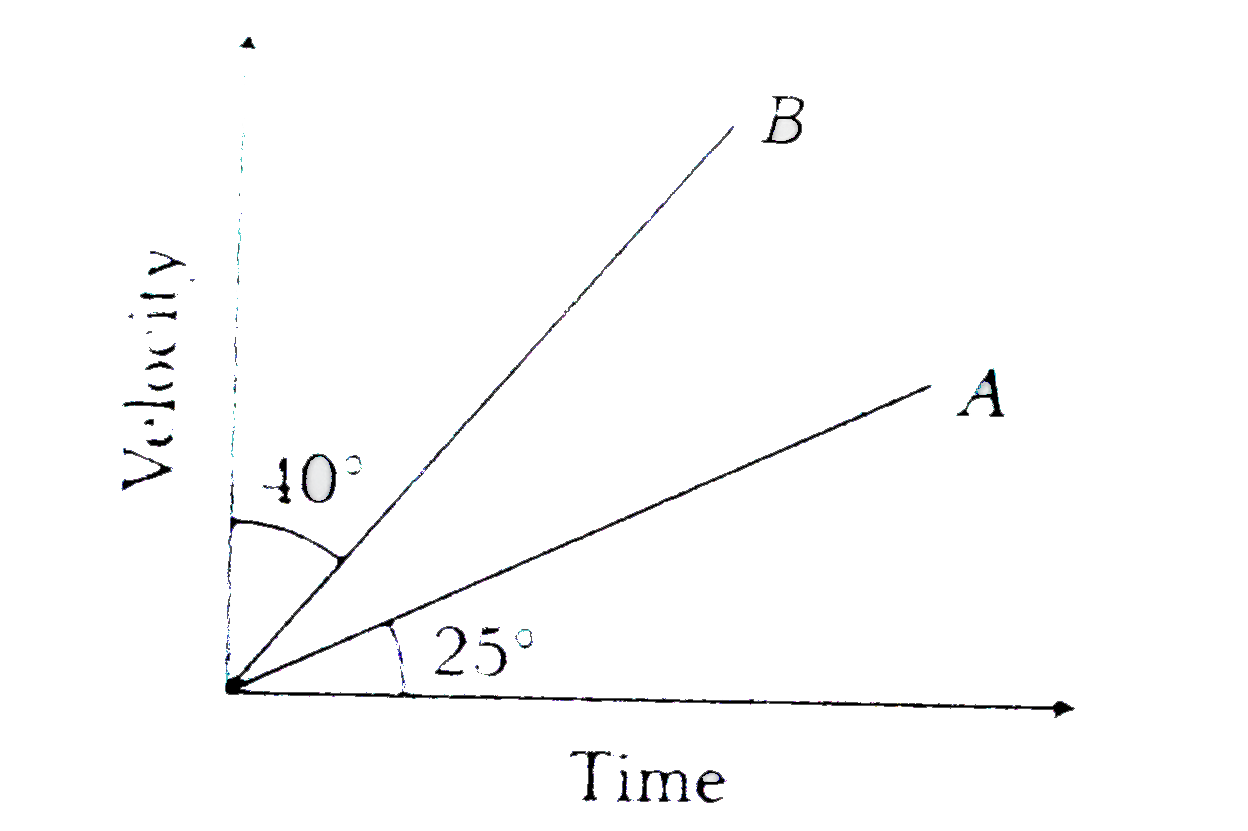
- The velocity - time graph for two bodies A and B are shown in figure. ...
Text Solution
|
- A body starts from rest at time t = 0 , the acceleration time graph is...
Text Solution
|
- The velocity - time graph of two bodies A and B is shown in figure. Ch...
Text Solution
|
- (a) Look at the velocity time graph of two bodies A and B , Figure. wh...
Text Solution
|
- (a) The velocity time graph of two bodies are shown in Figure. Slope o...
Text Solution
|
- The velocity time graphs of two bodies A and B are shown in Figure. Ob...
Text Solution
|
- The displacement-time graphs of two bodies A and B are OP and OQ respe...
Text Solution
|
- The velocity-time graph of a body is shown in figure. The ratio of mag...
Text Solution
|
- The displacement time graphs of two bodies A and B are shown in figure...
Text Solution
|