


Similar Questions
Explore conceptually related problems
Recommended Questions
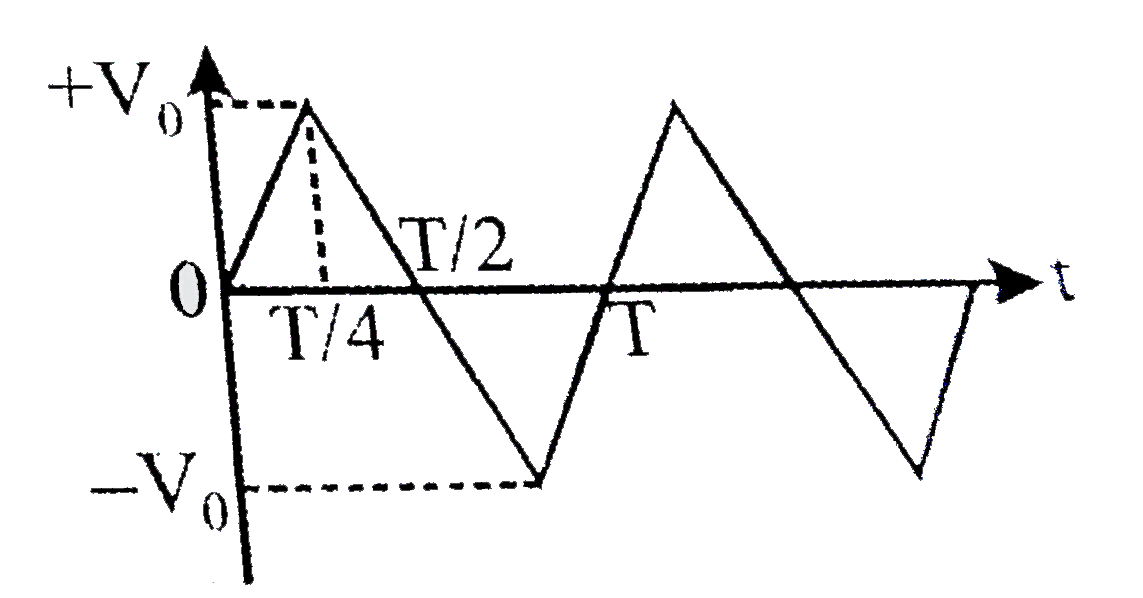
- The voltage time (V-t) graph for triangular wave having peak value V(0...
Text Solution
|
- The voltage time (V-t) graoh for triangular wave having peak value (V0...
Text Solution
|
- Give expression for average value of a.c. voltage V = V(0) sin omega t...
Text Solution
|
- The voltage time (V-t) graph for triangular wave having peak value V(0...
Text Solution
|
- The average and RMS value of voltage for square wave shown in figure-5...
Text Solution
|
- The voltage supplied to a circuit is given by V=V(0)t^(3/2) , where t ...
Text Solution
|
- The rms value of the saw-tooth voltage of peak value V(0) from t=0 to ...
Text Solution
|
- The average value of a saw-tooth voltage V=V(0) ((2t)/(T)-1) Over 0 to...
Text Solution
|
- एक प्रत्यावर्ती विभवांतर V = V(m) sin omega t के लिए समयांतराल t = 0 ...
Text Solution
|