


Similar Questions
Explore conceptually related problems
Recommended Questions
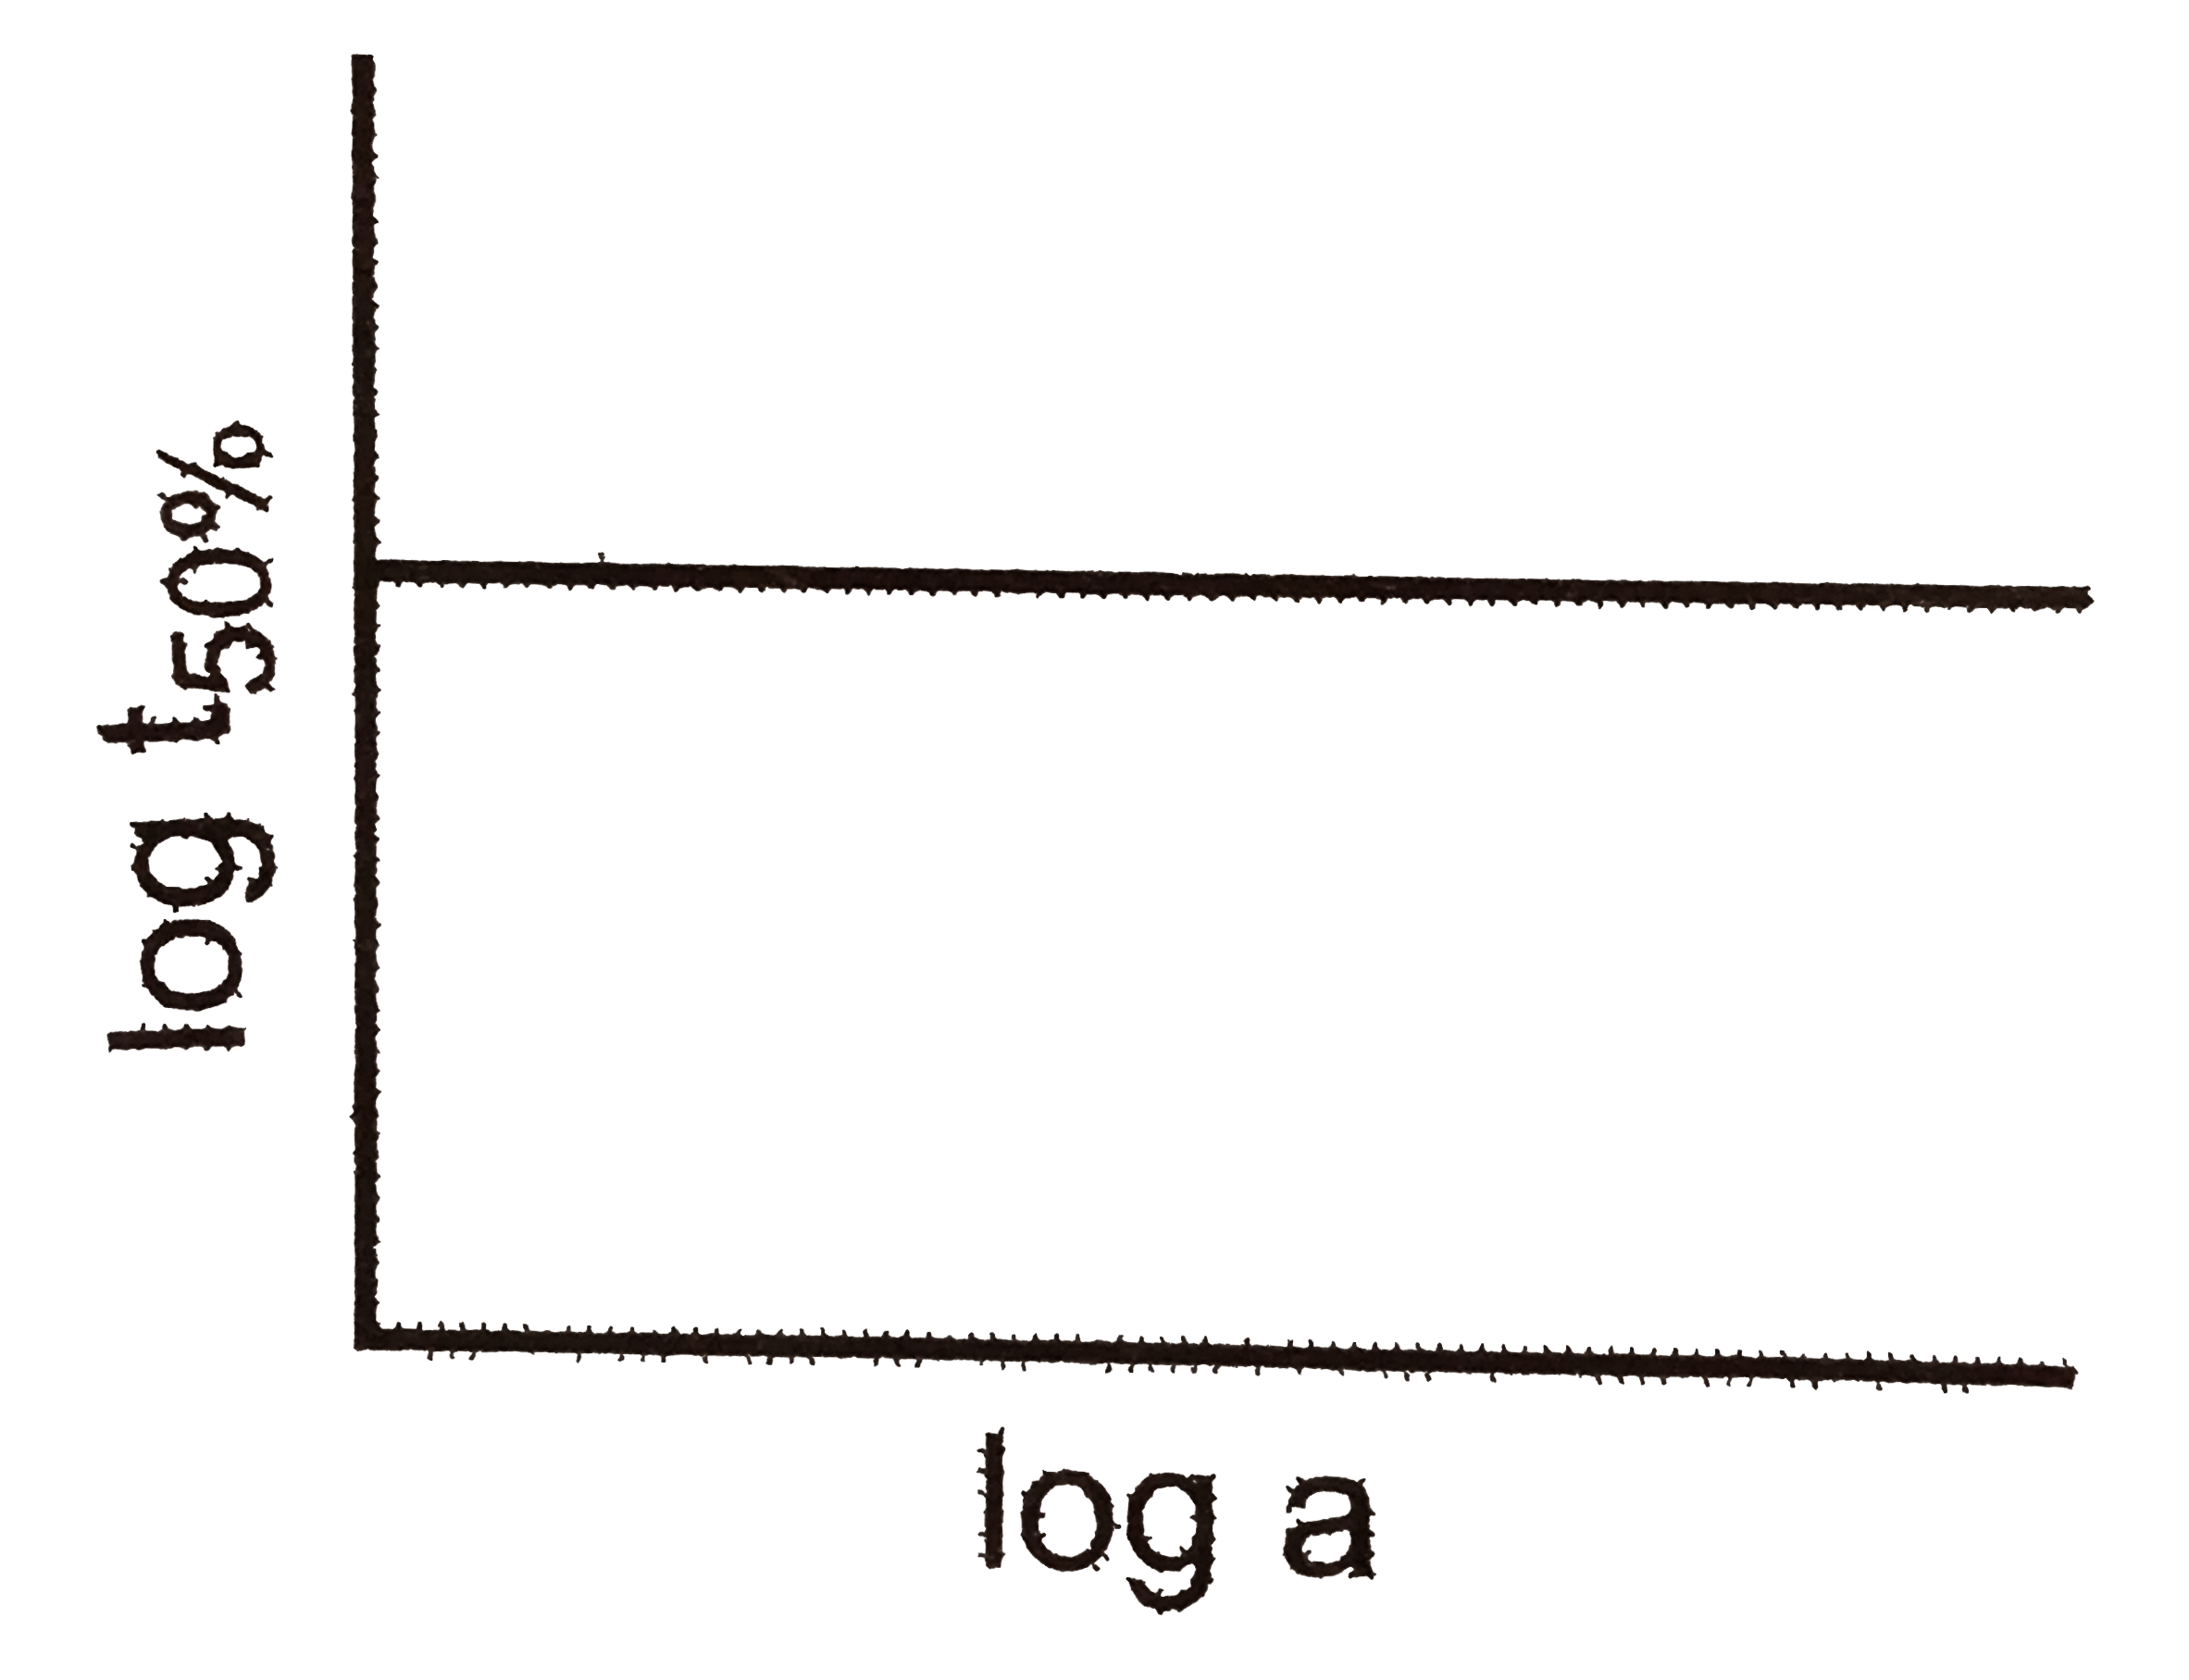
- A graph plotted between log t(50%) vs log concentration is a straight ...
Text Solution
|
- Draw the plot log V vs log T.
Text Solution
|
- A graph plotted between log t(50%) vs log concentration is a straight ...
Text Solution
|
- Which conclusion can be drawn if a graph is plotted between log t(50%)...
Text Solution
|
- What will be the order of reaction and rate constant for a chemical ch...
Text Solution
|
- A graph plotted between log k vs (1)/(T) is represented by
Text Solution
|
- A graph plotted between log t(50%) vs log concentration is a straight ...
Text Solution
|
- A graph plotted between log t(50%) vs log concentration in a straight ...
Text Solution
|
- What will be the order of reaction and rate constant for a chemical ch...
Text Solution
|