


Similar Questions
Explore conceptually related problems
Recommended Questions
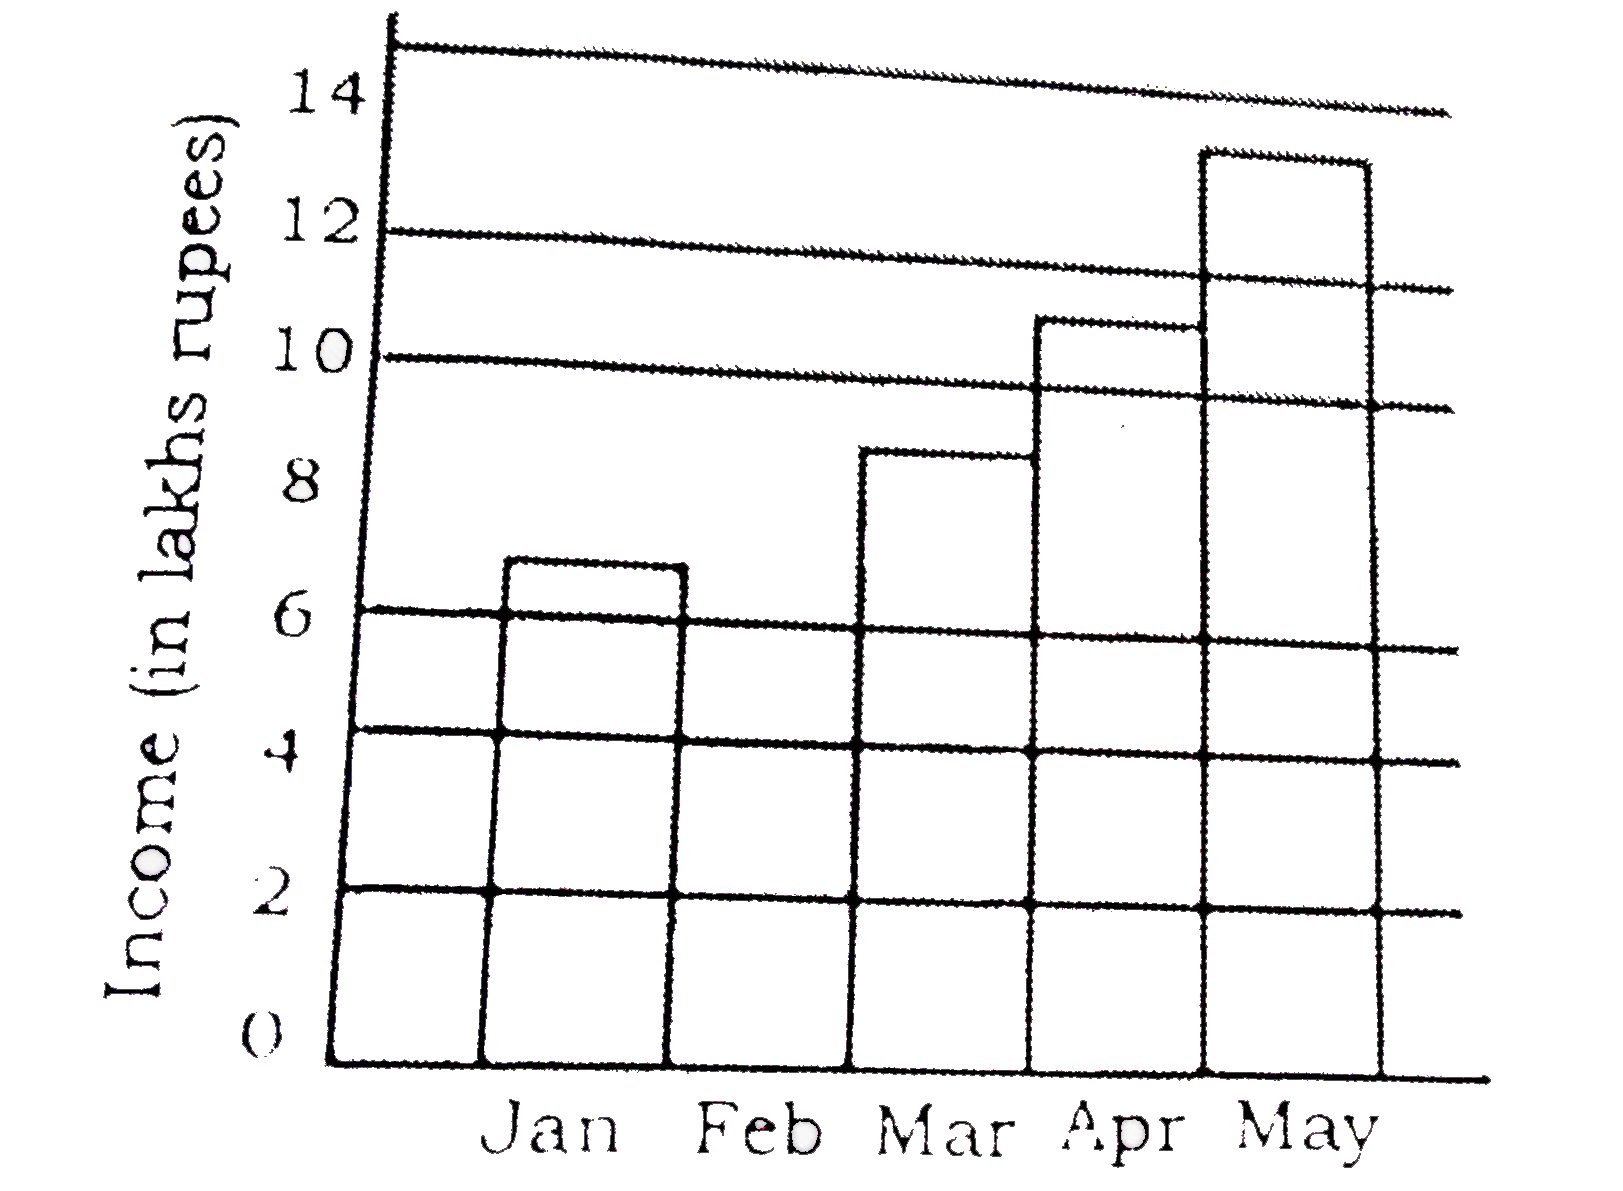
- यहाँ दिया गया बार ग्राफ एक कंपनी की आय दर्शता है। बार ग्राफ का अध्ययन ...
Text Solution
|
- Match the following Column A to Column B
Text Solution
|
- समाचार-पत्र की आय का प्रमुख स्रोत क्या है?
Text Solution
|
- समाचार-पत्र की आय का प्रमुख स्रोत क्या है ?
Text Solution
|
- समाचार-पत्र की आय का प्रमुख स्रोत क्या है ?
Text Solution
|
- समाचार-पत्र की आय का प्रमुख स्रोत क्या है ?
Text Solution
|
- The income of A is 25% more than that of B and the income of C is 65% ...
Text Solution
|
- The income of A is 24% more than the income of B. By what percent is t...
Text Solution
|
- The income of A is 40 % more than that of B. A got a 25% rise in his i...
Text Solution
|