


Topper's Solved these Questions
STATISTICS
OSWAAL PUBLICATION|Exercise TOPIC -1 MEAN, MEDIAN AND MODE (LONG ANSWER TYPE QUESTIONS- I )|11 VideosSTATISTICS
OSWAAL PUBLICATION|Exercise TOPIC -1 MEAN, MEDIAN AND MODE (LONG ANSWER TYPE QUESTIONS - II )|12 VideosSTATISTICS
OSWAAL PUBLICATION|Exercise TOPIC -1 MEAN, MEDIAN AND MODE (VERY SHORT ANSWER TYPE QUESTIONS )|1 VideosSSLC KARNATAKA TOPPERS' ANSWERS MARCH 2018 Class-X
OSWAAL PUBLICATION|Exercise SECTION-E |4 VideosSURFACE AREA AND VOLUMES
OSWAAL PUBLICATION|Exercise EXERCISE 15.5|5 Videos
Similar Questions
Explore conceptually related problems
OSWAAL PUBLICATION-STATISTICS-TOPIC -1 MEAN, MEDIAN AND MODE (SHORT ANSWER TYPE QUESTIONS )
- Given below is the distribution of weekly pocket money received by stu...
Text Solution
|
- Find the mean of the following distribution :
Text Solution
|
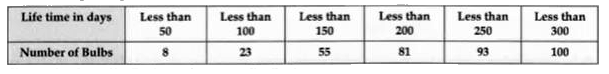
- The following table gives the life time in days of 100 bulbs: Ch...
Text Solution
|
- Find the unknown values in the following table :
Text Solution
|
- Calculate the median from the following data :
Text Solution
|
- Find the sum of the lower limit of the median class and the upper limi...
Text Solution
|
- Write the relationship connecting three measures of central tendencies...
Text Solution
|
- The following distribution shows the marks scored by 140 students in a...
Text Solution
|
- Find the unknown entries a, b, c, d in the following distribution of h...
Text Solution
|
- Find the mode of the following distribution :
Text Solution
|
- Find x and y from the following cumulative frequency distribution:
Text Solution
|
- The frequency distribution of agricultural holdings in a village is gi...
Text Solution
|
- Write the median class of the following distribution:.
Text Solution
|
- The following are the ages of 300 patients getting medical treatment i...
Text Solution
|
- Find the mean of the following data :
Text Solution
|
- Find the mean number of plants per house from the following data :
Text Solution
|
- Given below is a cumulative frequency distribution showing the marks s...
Text Solution
|
- Find the mode of the following frequency distribution :
Text Solution
|
- Find the mean of the following frequency distribution:
Text Solution
|
- Find the mean of first five odd multiples of 5.
Text Solution
|