


Topper's Solved these Questions
STATISTICS
OSWAAL PUBLICATION|Exercise TOPIC -1 MEAN, MEDIAN AND MODE (LONG ANSWER TYPE QUESTIONS - II )|12 VideosSTATISTICS
OSWAAL PUBLICATION|Exercise TOPIC-2 CUMULATIVE FREQUENCY GRAPH (VERY SHORT ANSWER TYPE QUESTIONS )|2 VideosSTATISTICS
OSWAAL PUBLICATION|Exercise TOPIC -1 MEAN, MEDIAN AND MODE (SHORT ANSWER TYPE QUESTIONS )|33 VideosSSLC KARNATAKA TOPPERS' ANSWERS MARCH 2018 Class-X
OSWAAL PUBLICATION|Exercise SECTION-E |4 VideosSURFACE AREA AND VOLUMES
OSWAAL PUBLICATION|Exercise EXERCISE 15.5|5 Videos
Similar Questions
Explore conceptually related problems
OSWAAL PUBLICATION-STATISTICS-TOPIC -1 MEAN, MEDIAN AND MODE (LONG ANSWER TYPE QUESTIONS- I )
- Calculate the median for the following data
Text Solution
|
- Calculate the mean of the following frequency distribution:
Text Solution
|
- A school conducted a test (of 100 marks) in English for studentt of Cl...
Text Solution
|
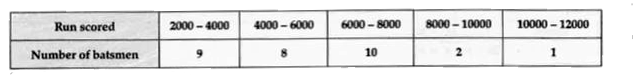
- The following frequency distribution shows the number of runs scored b...
Text Solution
|
- A group of stvdents conducted a survey of their locality to collect th...
Text Solution
|
- If the mean of the following data is 14.7, find the values of p and q.
Text Solution
|
- Find the mean and mode of the following frequency distribution :
Text Solution
|
- The following t.able showw the weights (in gms) of a sample of 100 app...
Text Solution
|
- Weekly income of 600 families is given below: Find the median.
Text Solution
|
- Find the mean of the following data :
Text Solution
|
- Find the mean of the following data :
Text Solution
|