Text Solution
Verified by Experts


Topper's Solved these Questions
ELECTRICITY
OSWAAL PUBLICATION|Exercise TOPIC-1 (Short Answer Type Questions -I)|13 VideosELECTRICITY
OSWAAL PUBLICATION|Exercise TOPIC-1 (Short Answer Type Questions -II)|18 VideosELECTRICITY
OSWAAL PUBLICATION|Exercise TOPIC -1 (Match the Column )|1 VideosLIGHT-REFLECTION AND REFRACTION
OSWAAL PUBLICATION|Exercise NCERT CORNER (TEXTBOOK EXERCISES)|15 Videos
Similar Questions
Explore conceptually related problems
OSWAAL PUBLICATION-ELECTRICITY-TOPIC-1 (Very Short Answer Type Questions )
- Define one volt (IV) potential difference.
Text Solution
|
- Name the device that helps to maintain a potential difference anO!I~ a...
Text Solution
|
- What does an electric circuit mean ?
Text Solution
|
- State the relationship between 1 ampere and 1 coulomb.
Text Solution
|
- What is meant by potential difference between two points ?
Text Solution
|
- Name the physical quantity which is same in all the resistors when the...
Text Solution
|
- Name the physical quantity whose unit is volt/ ampere.
Text Solution
|
- A charge of 150 coulomb flows through a wire in one minute. Find the e...
Text Solution
|
- Calculate the number of electrons constituting one coulomb of c.harge....
Text Solution
|
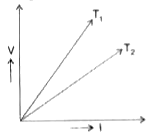
- The voltage-current (V-I) graph of a metallic conductor at two differe...
Text Solution
|
- A given length of a wire is doubled of itself and this process is repe...
Text Solution
|
- 400 J of heat is produced in 4 s in a 4 Omega resistor. Find potentia...
Text Solution
|
- State in brief the meaning of a variable resistoL Draw a circuit diagr...
Text Solution
|
- What happens to the resistance of a conductor when its aru of cross-se...
Text Solution
|
- Through which of the two wires, the electric current will flow more ea...
Text Solution
|
- The resistance of a ralstor Is kept constant and the potential differe...
Text Solution
|