Text Solution
Verified by Experts


Topper's Solved these Questions
ELECTRICITY
OSWAAL PUBLICATION|Exercise TOPIC-2 ( Multiple Choice Questions )|2 VideosELECTRICITY
OSWAAL PUBLICATION|Exercise TOPIC-2 ( Match the Column)|1 VideosELECTRICITY
OSWAAL PUBLICATION|Exercise TOPIC-1 (Short Answer Type Questions -II)|18 VideosLIGHT-REFLECTION AND REFRACTION
OSWAAL PUBLICATION|Exercise NCERT CORNER (TEXTBOOK EXERCISES)|15 Videos
Similar Questions
Explore conceptually related problems
OSWAAL PUBLICATION-ELECTRICITY-TOPIC-1 (Long Answer Type Questions )
- What does an electric circuit mean ? Name a device that helps to maint...
Text Solution
|
- Name an instrument that measures electric current in a circuit. Define...
Text Solution
|
- What the following symbols mean in an electric circuit. (a)
Text Solution
|
- Draw a closed circuit diagram consisting of 0.5 m long nichrome wire X...
Text Solution
|
- Draw a labelled circuit diagram to study a relationship betwee,w poten...
Text Solution
|
- Calculate the resistance of a conductor if the current flowing through...
Text Solution
|
- With the help of a circuit dillgram prove that when a number of resist...
Text Solution
|
- Two identical resistors each of resistance 10 ohm are connected in (i...
Text Solution
|
- i] State Ohm's law ii] Explain the factors on which the resistance o...
Text Solution
|
- Give any two differences between an ammeter and a voltmeter.
Text Solution
|
- How will you convert a given set of resistors so that the equivalent r...
Text Solution
|
- In the given circuit diagram, calculate : (a) the value of current t...
Text Solution
|
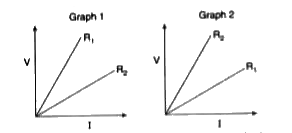
- Two students perform experiments on two given ralstors R(1) and R(2) a...
Text Solution
|
- An electric lamp of 24 Omega and a conductor of 6 Omega are connected ...
Text Solution
|
- Draw a circuit diagram for a circuit consisting of a battery of five c...
Text Solution
|