


Similar Questions
Explore conceptually related problems
Recommended Questions
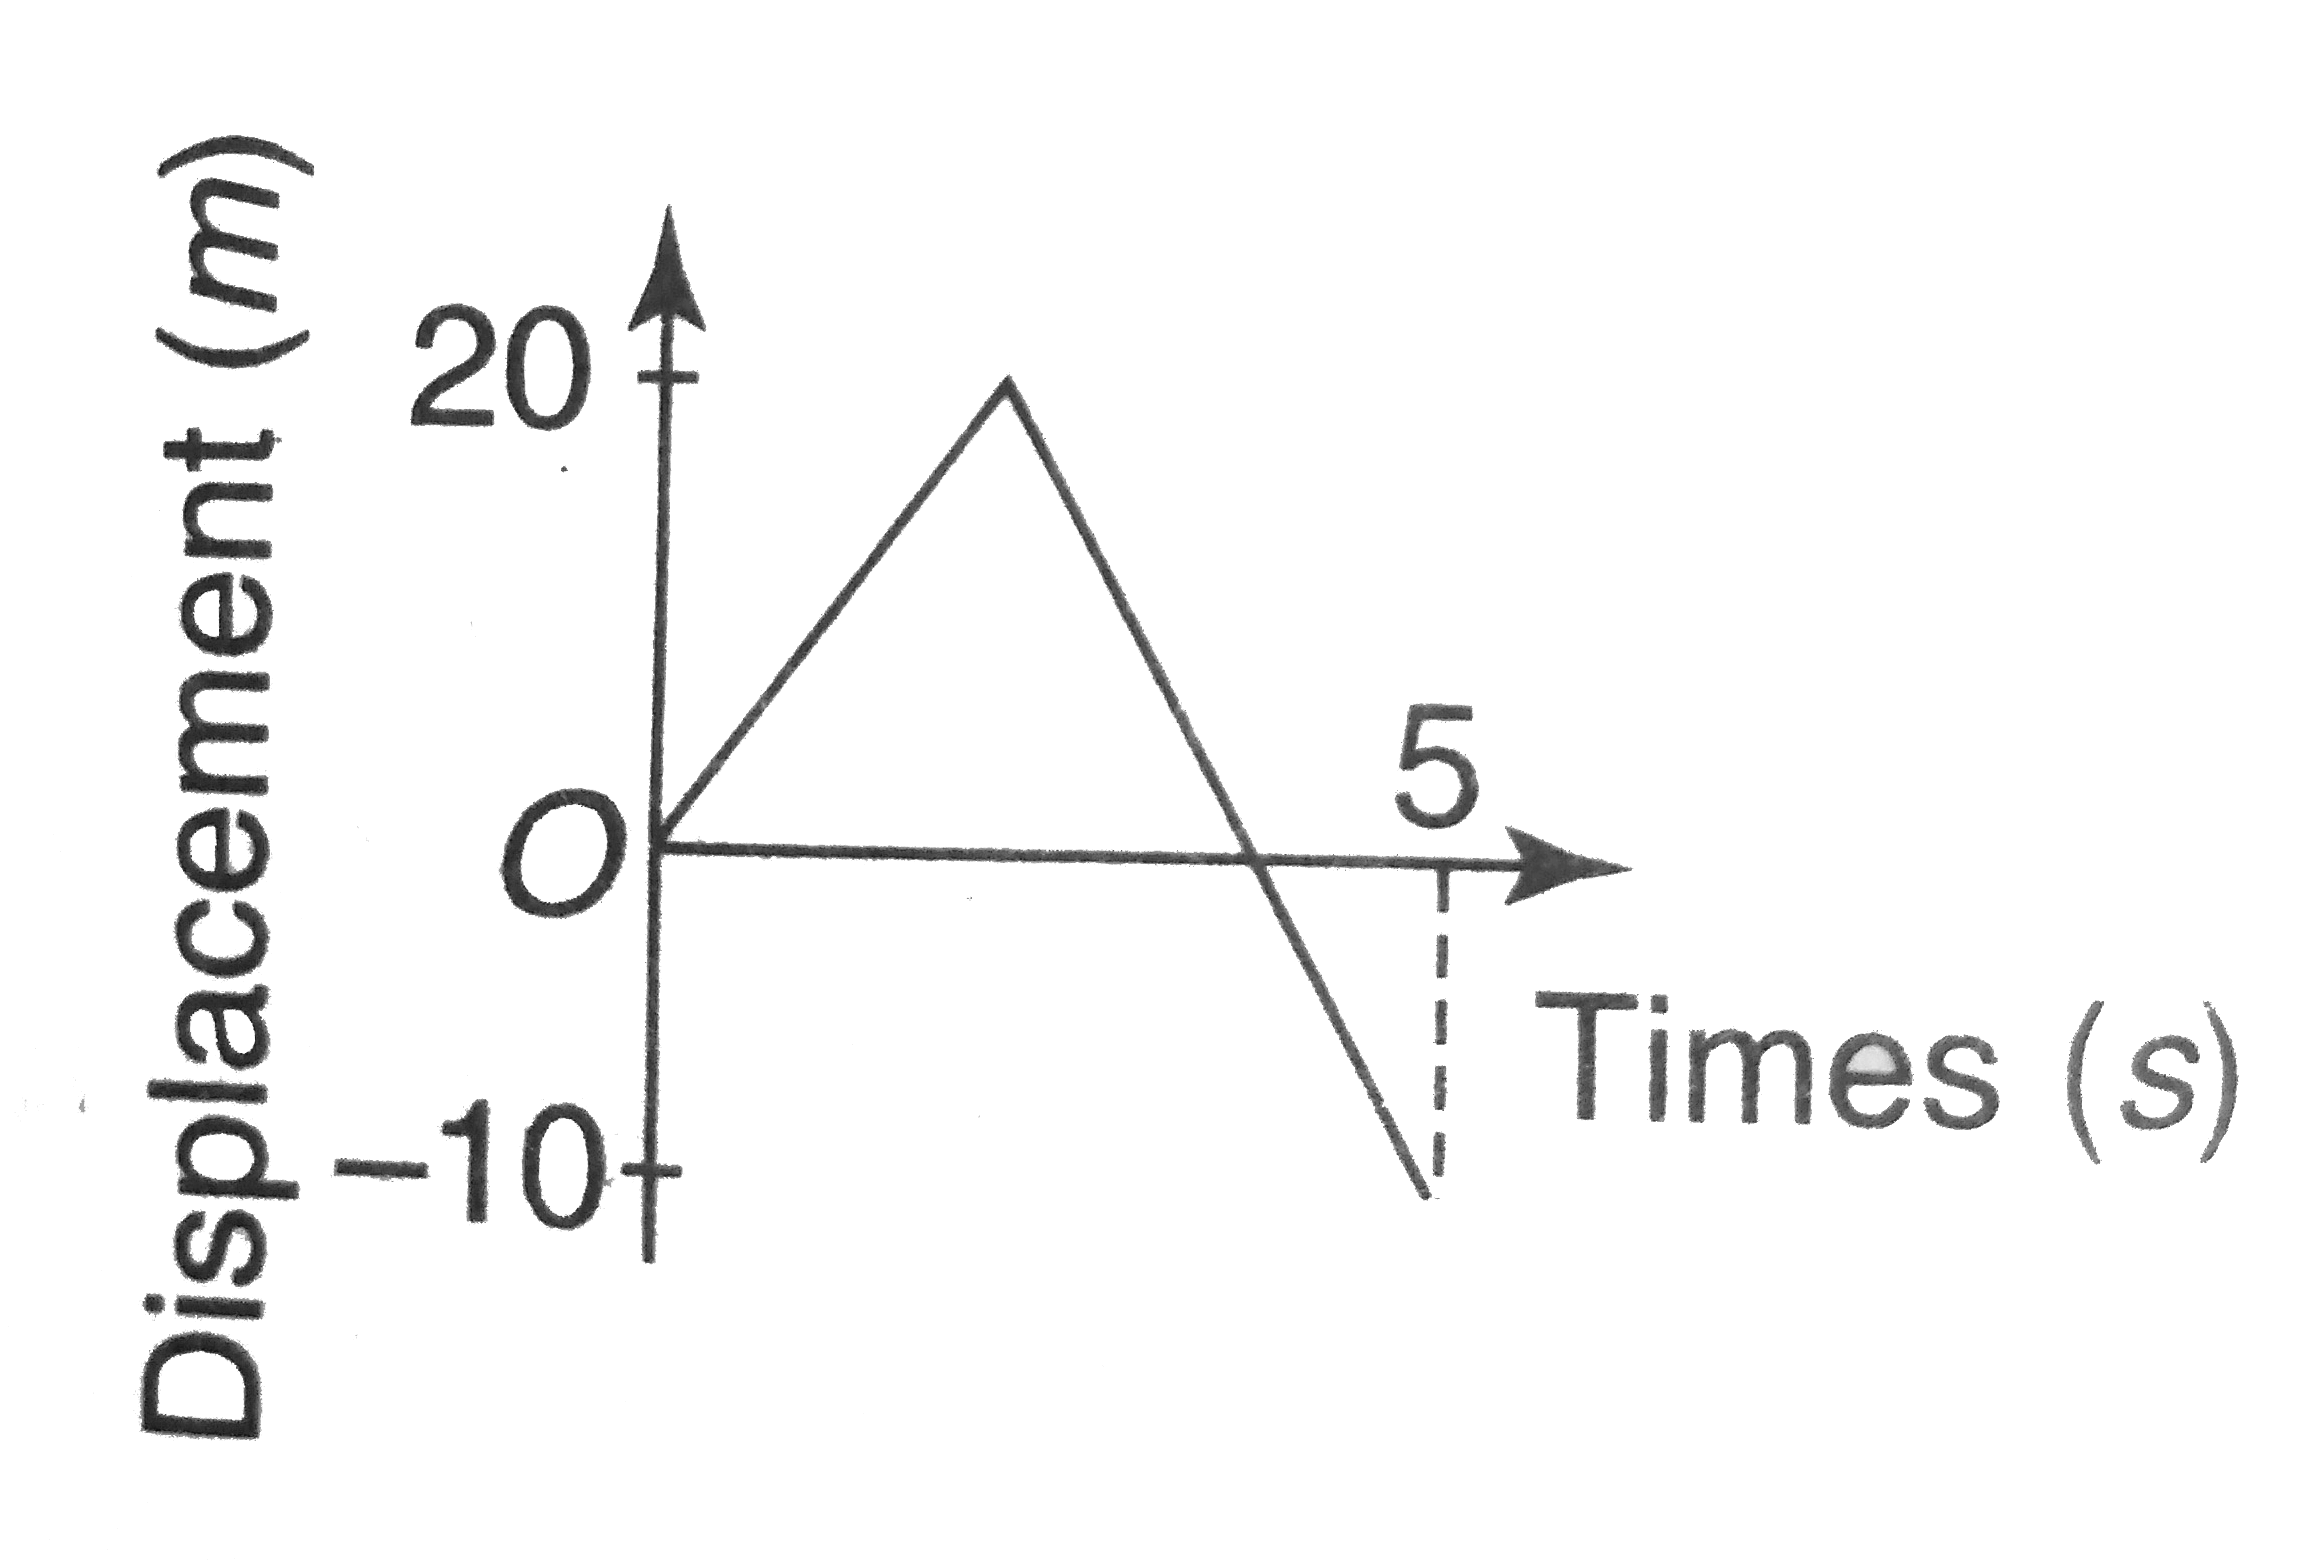
- The diagram shows the displacement-time graph for a particle moving in...
Text Solution
|
- Velocity of a particle moving in a straight line varies with its displ...
Text Solution
|
- Velocity-time graph of a particle moving in a straight line is shown i...
Text Solution
|
- Figure shows the displacement-time graph of a particle moving in a str...
Text Solution
|
- Acceleration-time graph of a particle moving in a straight line is as ...
Text Solution
|
- The diagram shows the displacement-time graph for a particle moving in...
Text Solution
|
- For which of the following graphs the average velocity of a particl mo...
Text Solution
|
- The diagram shows the displacement - time graph for a particle moving ...
Text Solution
|
- The diagram shows the displacement-time graph for the particle moving ...
Text Solution
|