Home
Class 12
MATHS
Frequency curves for the distribution of...


Frequency curves for the distribution of blood pressure readings of certain anthletes before exercise (A) and after exercise (B) are plotted together as shown in the figure above. From the frequency curves, which one of hte following can be concluded?

A

Both distributions are identical

B

Both distributions have the same mean value

C

Both distributions have the same bean value but different variance

D

Both distributions have the same variance but different mean values

Text Solution

Verified by Experts

The correct Answer is:
D

From observation of the graph it is noted the nature is similar, but are centered around different values, hence, they have same variance, but different mean values.
Promotional Banner

Topper's Solved these Questions

  • SETS, RELATIONS, FUNCTIONS AND NUMBER SYSTEM

    NDA PREVIOUS YEARS|Exercise MCQ|271 Videos
  • TRIGONOMETRY - RATIO & IDENTITY , TRIGONOMETRIC EQUATIONS

    NDA PREVIOUS YEARS|Exercise MCQ|238 Videos

Similar Questions

Explore conceptually related problems

The frequency curve for the distribution of income in a region is positively skewed as shown in the figure above. Then, for this distribution

The following questions are based on the diagram given below showing four persons stationed at the four corners of a square piece of plot as shown. From the original position given in the above figure, A and B move one arm length clockwise and then cross over to the comer diagonally opposite, C and D move one arm.length anti-clockwise and cross over the corner diagonally opposite. The original configuration ADBC has now changed to

A lake filled with water has depth H, A pipe of length slightly less than H lies at the bottom of the lake. It contains an ideal gas filled up to a length of (H)/(10) A smooth an ideal gas filled up to a length gas in place. Now the pipe is slowly raised to vertical position (see figure). Assume that temperature of the gas remains Constant and neglect the atmospheric pressure. (a) Plot the variation of pressure inside the lake as a function of height y from the base. Let the height of piston frm the base, after the pipe is made vertical, by y. plot the variation of gas pressure as a function of y in the first graph itself. (b) In equilibrium the gas pressure and the pressure due to water on the piston must be equal. Using this solve for equilibrium height y_(0) of the piston. You get two answers. Which one is correct and why?

Consider the following statements pertaining to a frequency polygon of a frequency distribution of a continuous variable with seven class intervals of equal width: 1. The original frequency distribution can be reconstructed from the frequency polygon. 2. The frequency polygon touches the x-axis in its extreme right and extreme left. Which of the above statements is/are correct?

NDA PREVIOUS YEARS-STATISTICS-MCQs
  1. Which one of the following statement is correct ?

    Text Solution

    |

  2. The mean weight of all the students in a certain class is 60 kg. The m...

    Text Solution

    |

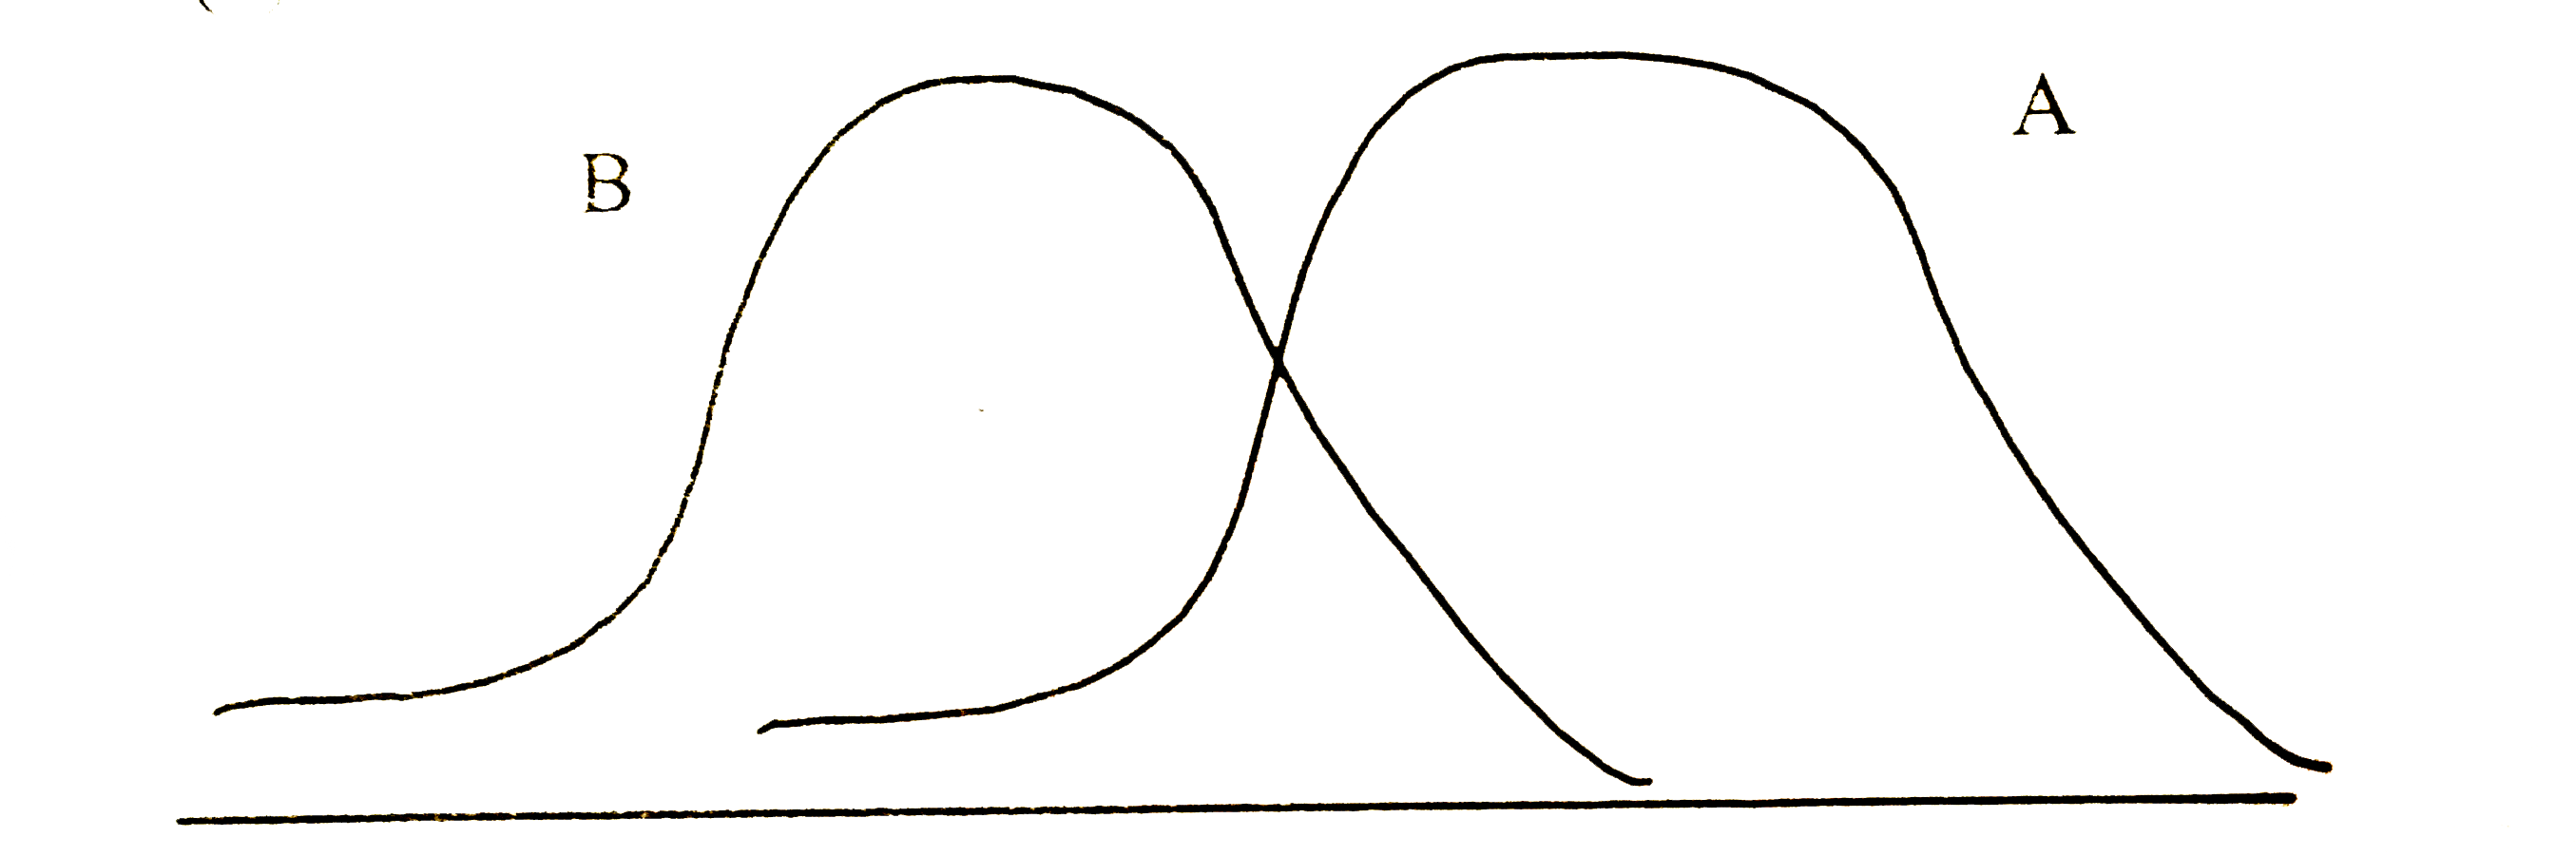
  3. Frequency curves for the distribution of blood pressure readings of ce...

    Text Solution

    |

  4. If the slopes of the line of regression of Y and X and of X and Y are ...

    Text Solution

    |

  5. Which one of the following measures is the most suitable one of centra...

    Text Solution

    |

  6. In a binomial distribution, the mean is 4 and the variance is 3. What ...

    Text Solution

    |

  7. If X is changed to a+hU and Y to b+kV, then which one of the following...

    Text Solution

    |

  8. Students of two schools appeared for a common test carrying 100 marks....

    Text Solution

    |

  9. If AM of numbers x(1),x(2)…..x(n) is mu, then what is tha AM of the nu...

    Text Solution

    |

  10. In computing a measure of the central tendency for any set of 51 numbe...

    Text Solution

    |

  11. The data below record and itemwise quarterly expenditure of a private ...

    Text Solution

    |

  12. While constructing the cumulative frequency column of a frequency dis...

    Text Solution

    |

  13. If in a frequency distribution table with 12 classes, the width of eac...

    Text Solution

    |

  14. Consider the following statements : The appropriate number of classe...

    Text Solution

    |

  15. The populations of four towns A, B, C and D as on 2001 are as follows:...

    Text Solution

    |

  16. Consider the two series of observations A and B as follows: If th...

    Text Solution

    |

  17. If n(1) and n(2) are the sizes, G(1) and G(2) the geometric means of t...

    Text Solution

    |

  18. Let barx be the mean of n observations x(1),x(2),……..,x(n). If (a-b) i...

    Text Solution

    |

  19. The frequency curve for the distribution of income in a region is posi...

    Text Solution

    |

  20. What is the value of n for which the numbers 1, 2, 3, …., n have varia...

    Text Solution

    |