Home
Class 12
MATHS
Consider the following data: What i...

Consider the following data:

What is the variability in the wages of the workers in Factory - A?

A

`100%` more than the variability in the wages of the workers in Factory - B

B

`50%` more than the variability in the wages of the workers in Factory - B

C

`50%` less than the variability in the wages of the workders in Factory - B

D

`150%` more than the variability in the wages of the workers in Factory - B

Text Solution

Verified by Experts

The correct Answer is:
B

`"Coefficient of variation"=(S.D)/("Mean")xx100`
`"For factory A"=(40.50)/(540)xx100=7.5`
`"For factory B"=(31)/(620)xx100=5`
`therefore "Variability in wages of A is "50% " more than the variability in wages of B."`
Promotional Banner

Topper's Solved these Questions

  • SETS, RELATIONS, FUNCTIONS AND NUMBER SYSTEM

    NDA PREVIOUS YEARS|Exercise MCQ|271 Videos
  • TRIGONOMETRY - RATIO & IDENTITY , TRIGONOMETRIC EQUATIONS

    NDA PREVIOUS YEARS|Exercise MCQ|238 Videos

Similar Questions

Explore conceptually related problems

Consider the following distribution of daily wages of 50 workers of a factory.Find the mean daily wages of the workers of the factor } - by using an apropriate method.

Consider the following distribution of daily wages of 50 workers of a factory. Daily wages: 100-120 120-140 140-160 160-180 180-200 (in Rs). Number of 12 14 8 6 10 workers: Find the mean daily wages of the workers of the factory by using an appropriate method.

Consider the following information regarding the number of men and women workers in three factories.I,II and III.Men workers Women workers I 30 a 25 II 2531 III 2726 Represent the above information in the form of 3xx2 matrix.What does the entry in the third row and second column represent?

Consider the following information regarding the number of men and women workers in three factories I, II and III. Men workers Women workers I 30 25 II 25 31 III 27 26 Represent the above information in the form of a 3 xx2 matrix. What does th

Find the mean of the daily wages of 60 workers in a factory as per given below

Study the graph and answer the question that follows What is the ratio of the total number of workers whose daily wages are less than Rs 500 to the total number of workers whose daily wages are Rs 600 and above?

NDA PREVIOUS YEARS-STATISTICS-MCQs
  1. The two lines of regression are 8x-10y=66 and 40x-18y=214 and variance...

    Text Solution

    |

  2. The standard deviation of some consecutive integers is found to be 2. ...

    Text Solution

    |

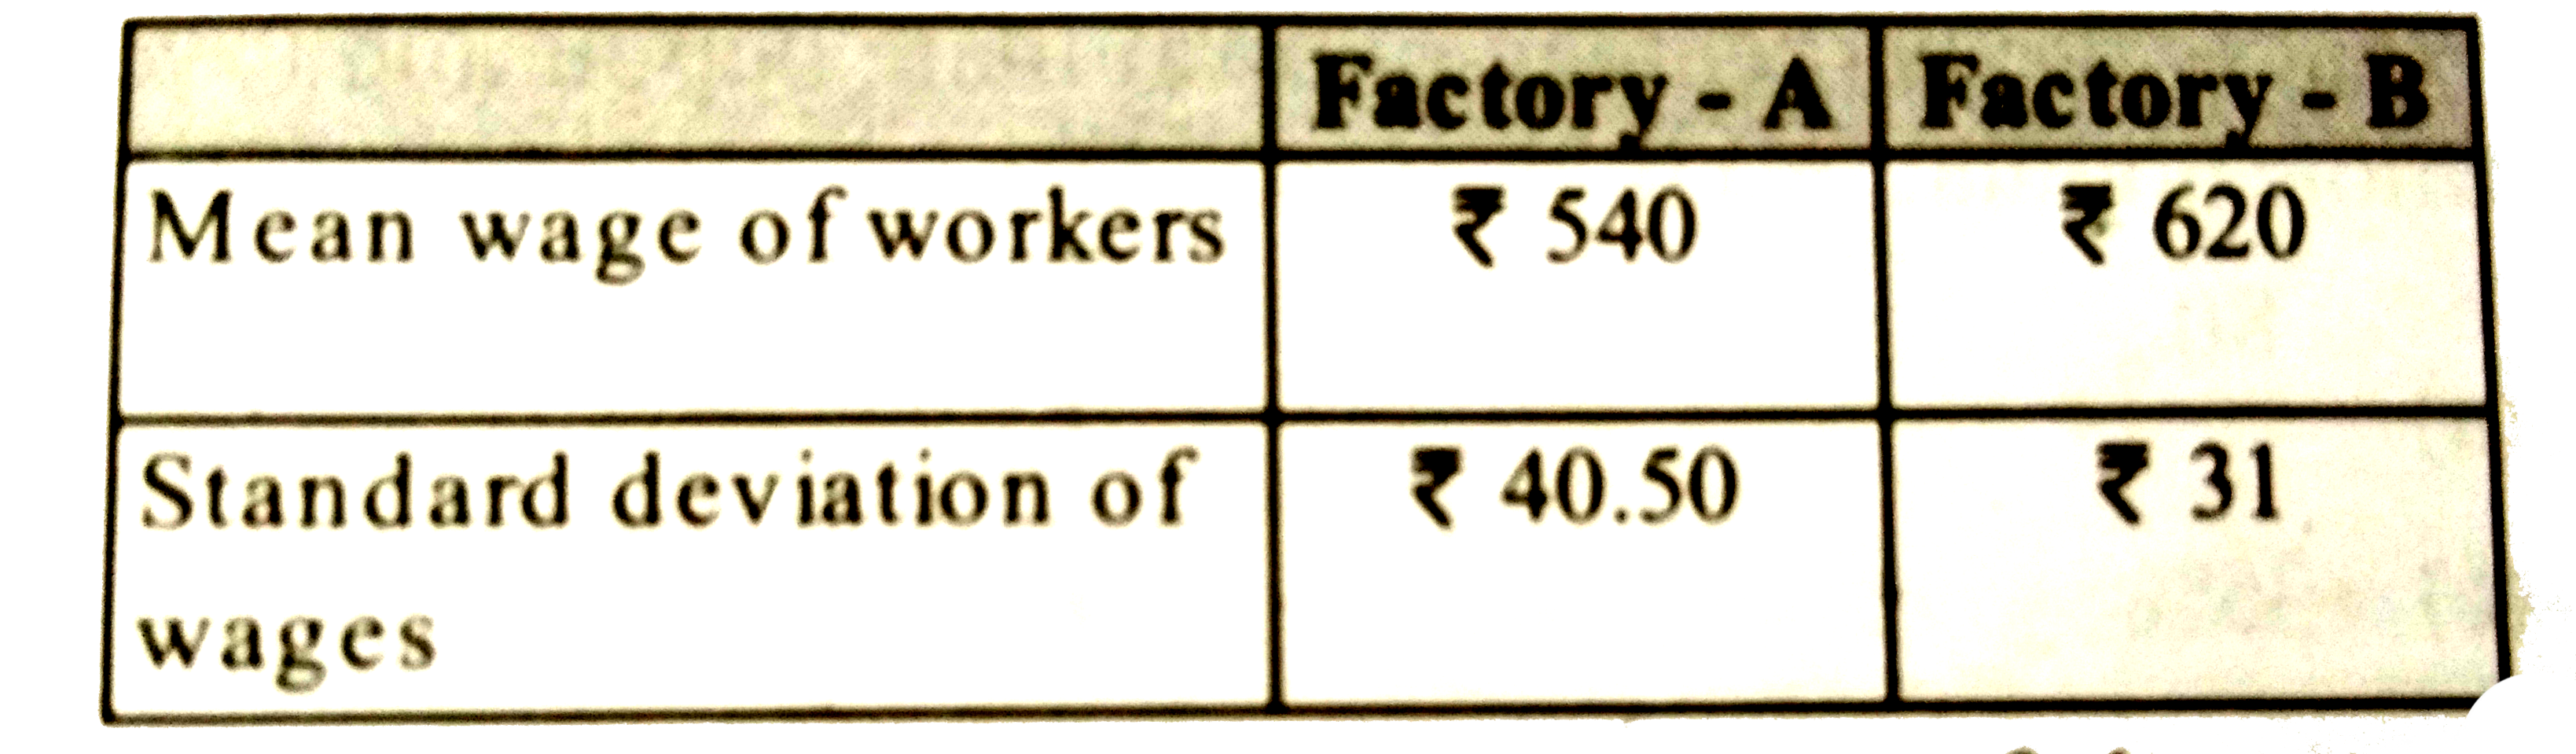
  3. Consider the following data: What is the variability in the wages...

    Text Solution

    |

  4. The distributions X and Y with total number of observations 36 and 64,...

    Text Solution

    |

  5. Consider the following data : {:(x,5,7,8,4,6),(y,2,4,3,2,4):} What...

    Text Solution

    |

  6. The frequency distribution of life of 90 TV tubes whose median life is...

    Text Solution

    |

  7. The frequency distribution of life of 90 TV tubes whose median life is...

    Text Solution

    |

  8. The frequency distribution of life of 90 TV tubes whose median life is...

    Text Solution

    |

  9. {:("Class Interval",1-5,6-10,11-15,16-20),("Frequency",3,7,6,5):} Co...

    Text Solution

    |

  10. {:("Class Interval",0.10,10-20,20-30,30-40,40-50),("Frequency",5,0,20,...

    Text Solution

    |

  11. {:("Class Interval",0.10,10-20,20-30,30-40,40-50),("Frequency",5,0,20,...

    Text Solution

    |

  12. Consider the following statements with regard to correlation coefficie...

    Text Solution

    |

  13. If the valuesof a set are measured in cm, what will be the unit of var...

    Text Solution

    |

  14. What is the cumulative frequency curve of statistical data commonly ca...

    Text Solution

    |

  15. The average daily income of workers of a factory including that of the...

    Text Solution

    |

  16. Which one of the following is the mean of the data given below? |{:(...

    Text Solution

    |

  17. Students of three sections of a class, having 30, 30 and 40 students a...

    Text Solution

    |

  18. If the variance of the data 2, 4, 5, 6, 17 is v, then what is the vari...

    Text Solution

    |

  19. 10 is the mean of a set of 7 observations and 5 is the mean of a set o...

    Text Solution

    |

  20. Some measures of central tendency for n discrete observations are give...

    Text Solution

    |