A
B
C
D
Text Solution
Verified by Experts
The correct Answer is:


Topper's Solved these Questions
Similar Questions
Explore conceptually related problems
NDA PREVIOUS YEARS-STATISTICS-MCQs
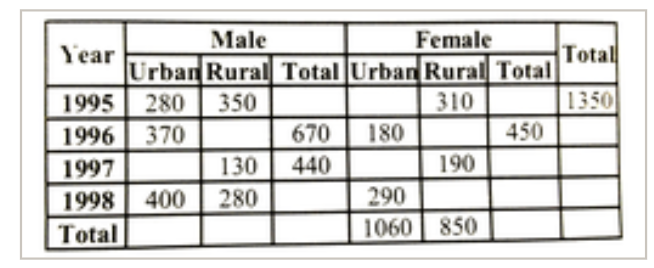
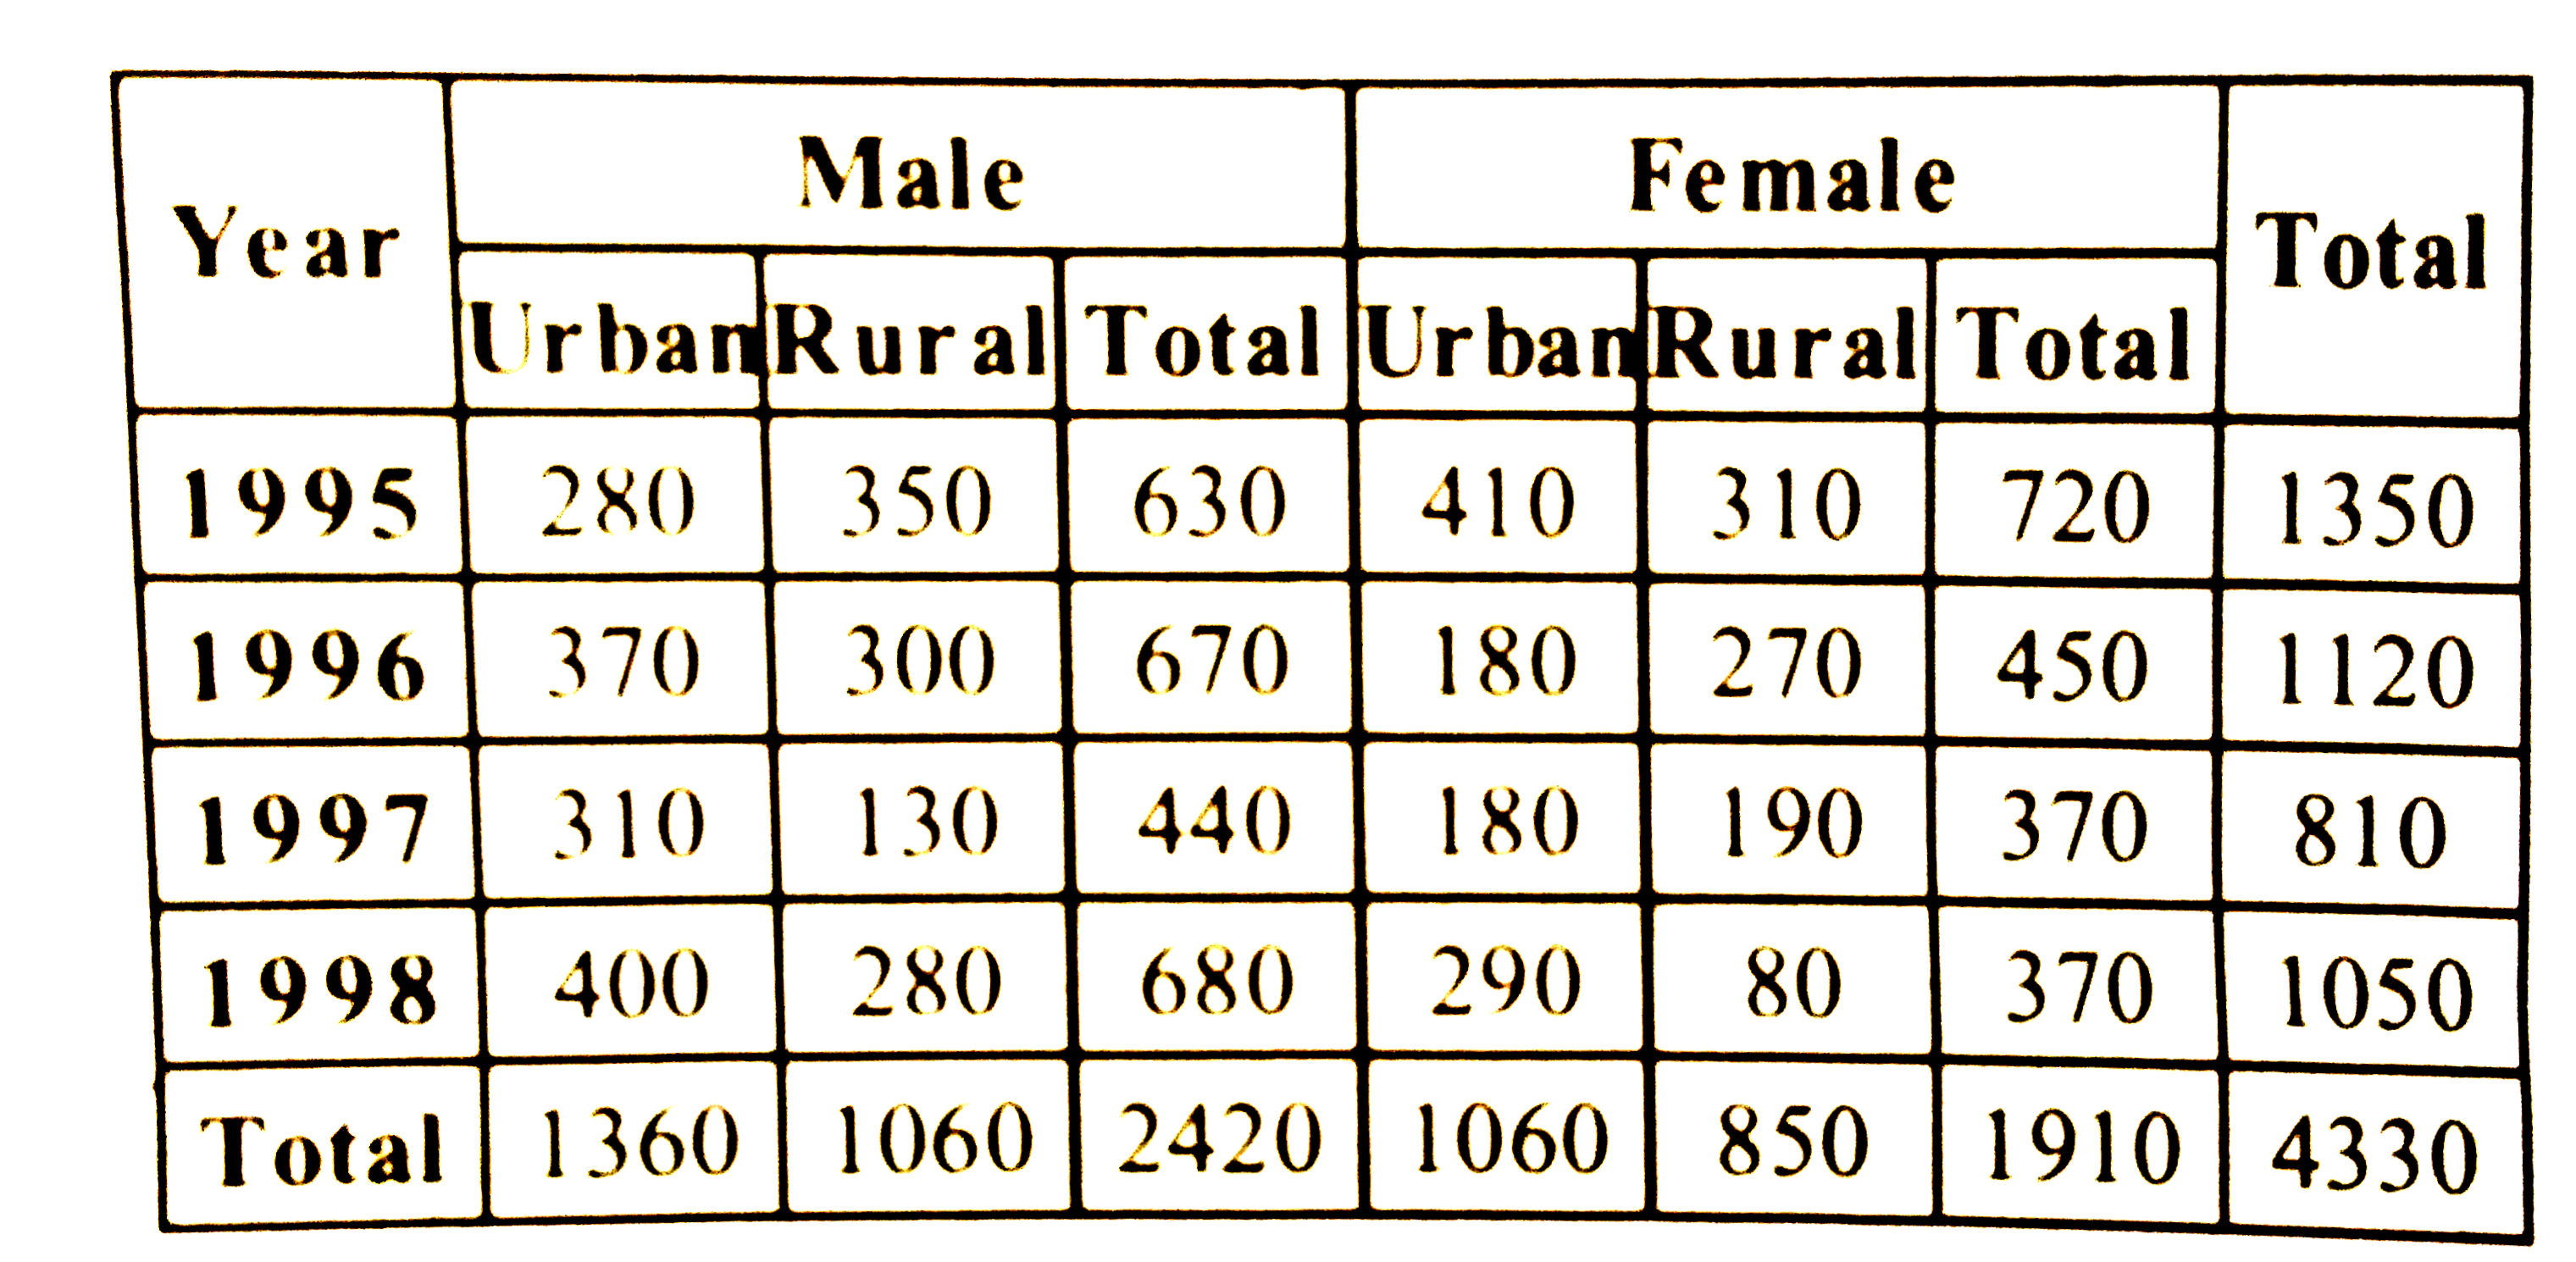
- What is the total population in the year 1998?
Text Solution
|
- What is the difference between the number of females and the number of...
Text Solution
|
- In which year is the male population minimum?
Text Solution
|
- In which year is the female population maximum?
Text Solution
|
- What is the percentage of rural male population (over the whole popula...
Text Solution
|
- The following pie chart gives he distribution of funds in a five year ...
Text Solution
|
- The following pie chart gives he distribution of funds in a five year ...
Text Solution
|
- The following pie chart gives he distribution of funds in a five year ...
Text Solution
|
- The following pie chart gives he distribution of funds in a five year ...
Text Solution
|
- What is the median of the distribution 3, 7, 6, 9, 5, 4, 2?
Text Solution
|
- What is the arithmetic mean of first 16 natural numbers with weights b...
Text Solution
|
- What is the mode for the data 20, 20, 20, 21, 21, 21, 21, 21, 22, 22, ...
Text Solution
|
- Consider the following statement: 1. A continuous random variable ca...
Text Solution
|
- Consider the following statements: 1. Two independent variables are ...
Text Solution
|
- A variate X takes value 2, 9, 3, 7, 5, 4, 3, 2, 10. What is the median...
Text Solution
|
- The mean of 10 observations is 5. If 2 is added to each observation an...
Text Solution
|
- The arithmetic mean of first n odd natural numbers, is
Text Solution
|
- The arithmetic mean of numbers a, b, c, d, e is M. What is the value o...
Text Solution
|
- The algebraic sum of the deviations of 20 observations measured from 3...
Text Solution
|
- The median of 27 observations of a variable is 18. Three more observat...
Text Solution
|