Home
Class 12
MATHS
The following table gives the monthly ex...

The following table gives the monthly expenditure of two families:

In constructing a pie diagram to the above data, the radii of the circles are to be chosen by which one of the following ratios?

A

`1:1`

B

`10:9`

C

`100:91`

D

`5:4`

Text Solution

Verified by Experts

The correct Answer is:
B

`"Total expenditure of A"=3,500+500+1,500+2,000+2,500`
`=10,000`
`"Total expenditure of B"=2,700+800+1,000+1,800+1,800`
`=8,100`
`"Area of A : Area of B"=10,000:8,100`
`=100:81`
`rArr " radius of A : radius of B"=sqrt(100):sqrt(81)`
`=10:9`
Promotional Banner

Topper's Solved these Questions

  • SETS, RELATIONS, FUNCTIONS AND NUMBER SYSTEM

    NDA PREVIOUS YEARS|Exercise MCQ|271 Videos
  • TRIGONOMETRY - RATIO & IDENTITY , TRIGONOMETRIC EQUATIONS

    NDA PREVIOUS YEARS|Exercise MCQ|238 Videos

Similar Questions

Explore conceptually related problems

The following table gives the monthly expenditure of two families In constructing a pie diagram to the above data, the radi of the circles are to be chosen by which one of the following ration?

Following table shows the monthly expenditure of Imrans family on various items.

The following table shows the monthly expenditure of different families on different items : Represent the data in the form of a sub-divided bar diagram.

The following table shows the expenditure of a family whose monthly income is* 22,000. Represent the above data by a pie chart.

The following information gives the monthly salaries of 100 employees . Find the mode of the data .

The following pie chart represents a total expenditure of 540000 on different items in constructing a flat in a town. The expenditure (inT)on cement is

The following pie-chart shows the monthly expenditure of a family on various items. If the family spends Rs. 825 on clothing, answer the question What is the total monthly income of the family?

The following pie diagram represents expenditure on different items in constructing a building. If the total construction cost of building is Rs540000 answer the following questions: i . Find the central angle for labour expenditure. ii . Find the expenditure on labour.

The following pie-chart shows the monthly expenditure of a family on food, house rent clothing, education, fuel and miscellaneous Study the pie-chart The central angle of the sector for the expenditure on fuel (in degrees) is

NDA PREVIOUS YEARS-STATISTICS-MCQs
  1. Which one of the following can be considered as appropriate pair of va...

    Text Solution

    |

  2. It is given that barX=10, barY=90, sigma(X)=3, sigma(Y)=12 and r(XY)=0...

    Text Solution

    |

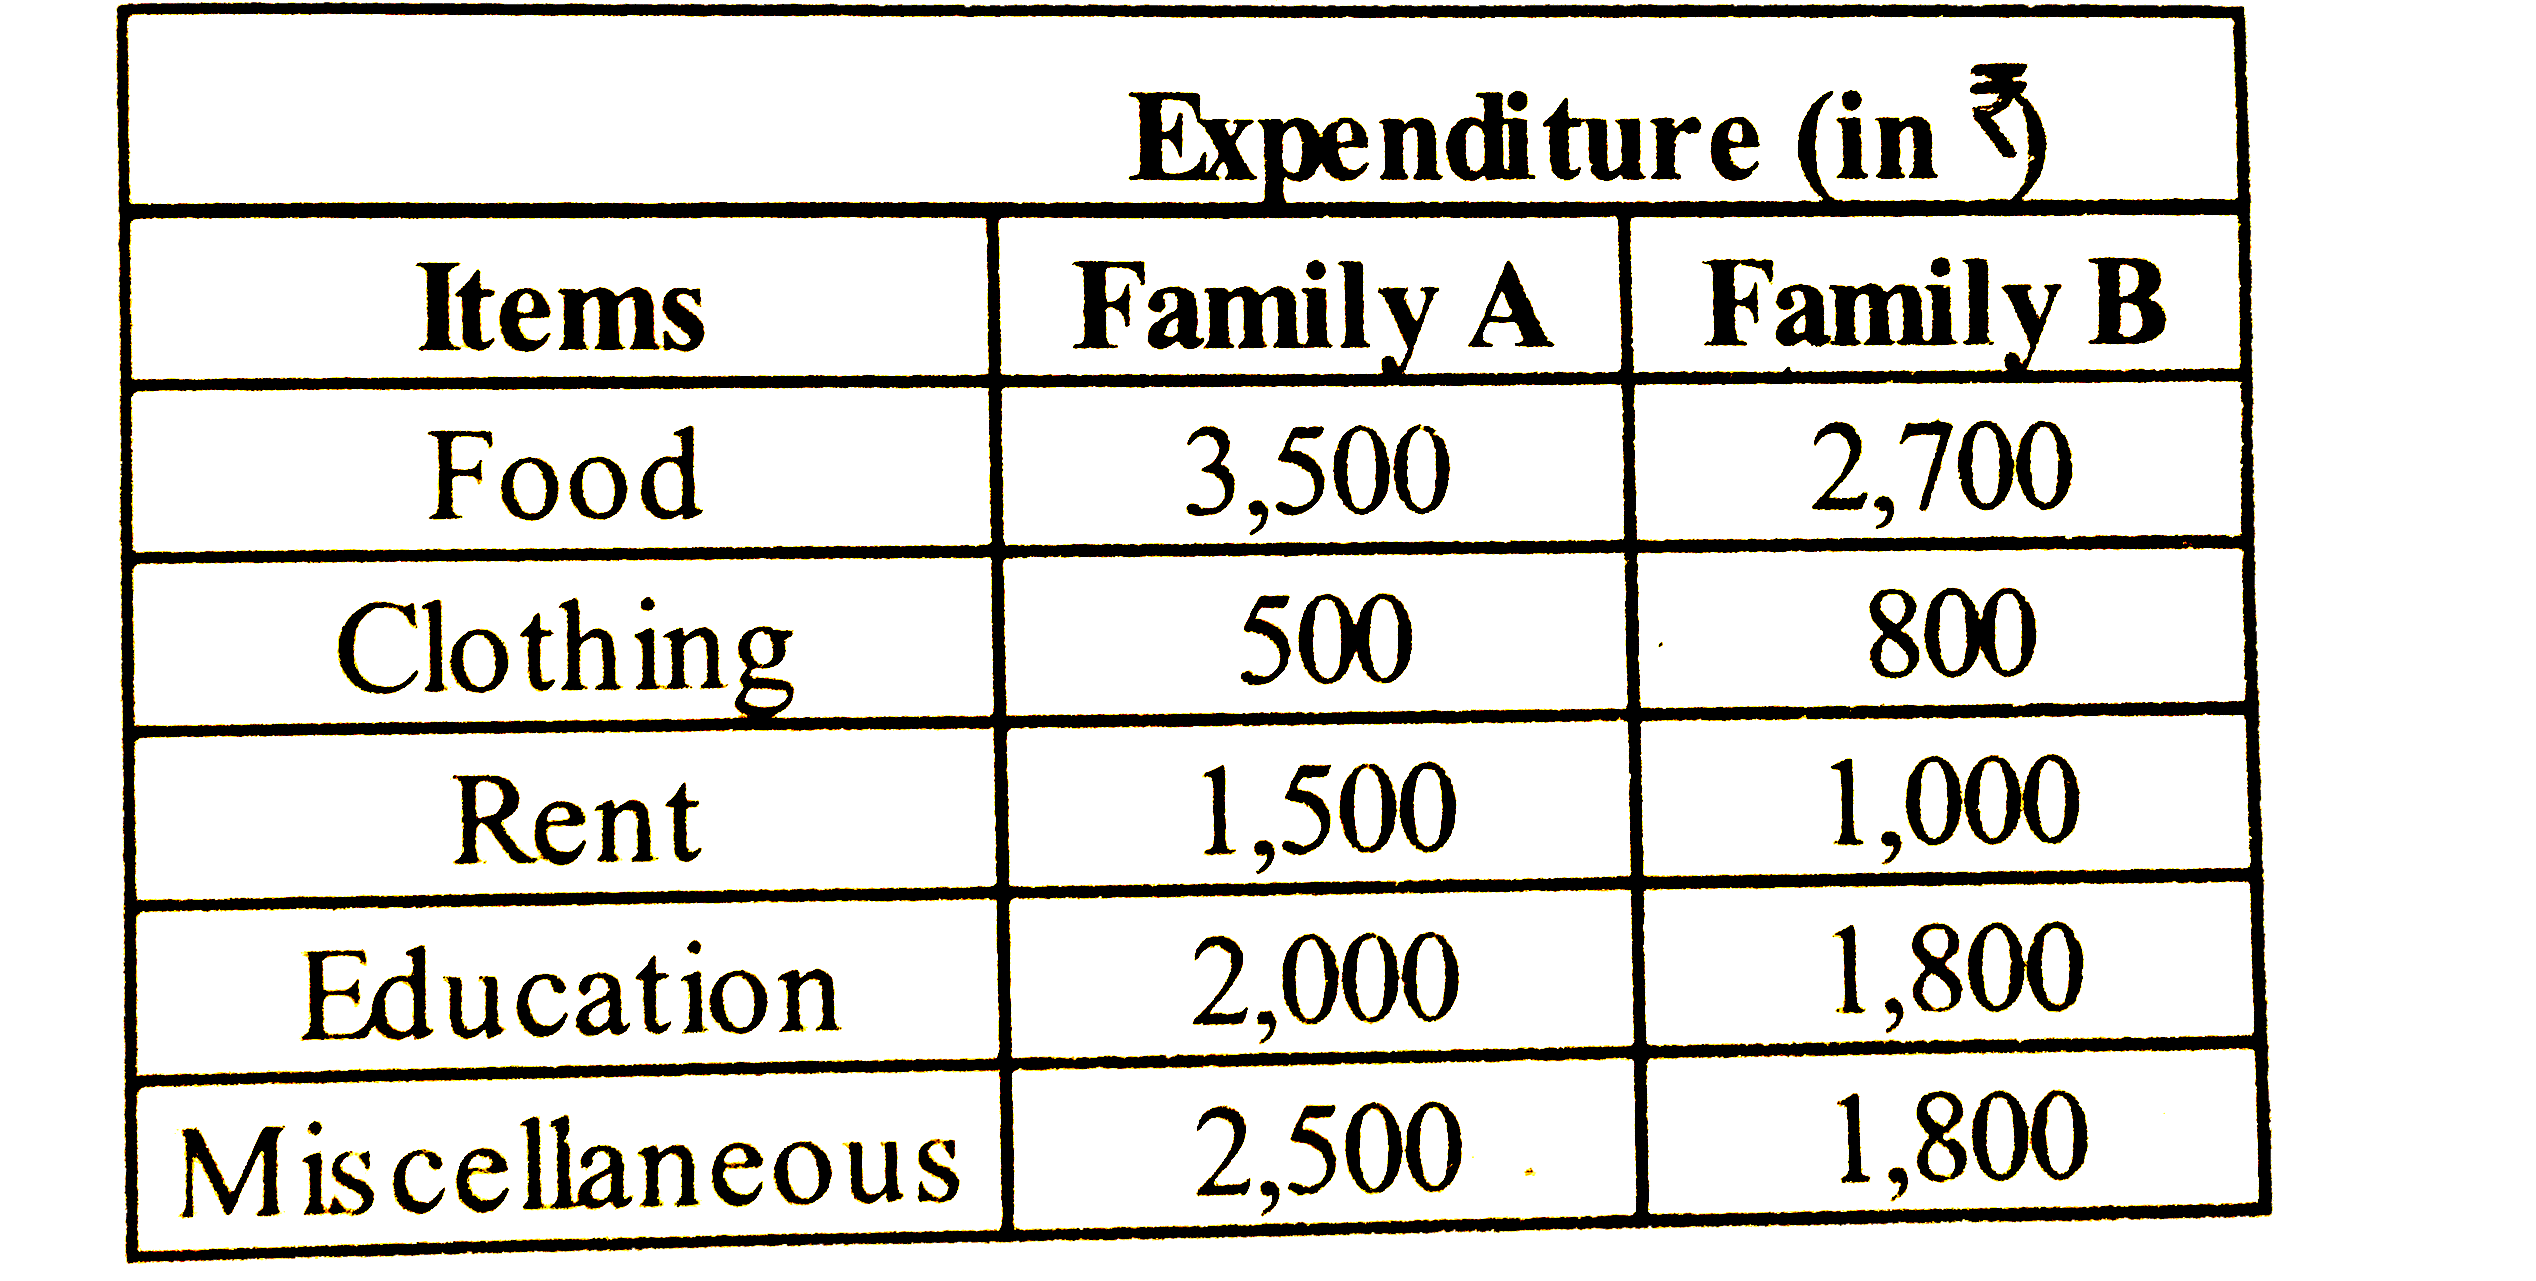
  3. The following table gives the monthly expenditure of two families: ...

    Text Solution

    |

  4. The mean of the values 0,1,2,3,....n, having corresponding weights C(n...

    Text Solution

    |

  5. Consider the following statements : 1. Variance is unaffected by cha...

    Text Solution

    |

  6. The coefficient of correlation when coefficients of regression are 0.2...

    Text Solution

    |

  7. In a Binominal distribution, the mean is three times its variance. Wha...

    Text Solution

    |

  8. If the correlation coefficient between x and y is 0.6, covariance is 2...

    Text Solution

    |

  9. Let barx be the mean of x(1),x(2),x(3),……..,x(n). If x(i)=a+cy(i) for ...

    Text Solution

    |

  10. Consider the following statements : 1. If the correlation coefficien...

    Text Solution

    |

  11. If 4x-5y+33=0 and 20x-9y=107 are two lines of regression, then what ar...

    Text Solution

    |

  12. Consider the following statements: 1. Mean in independent of change ...

    Text Solution

    |

  13. Consider the following statements: 1. Sum of deviations from mean is...

    Text Solution

    |

  14. What is the median of the numbers 4.6, 0, 9.3, -4.8, 7.6,2.3,12.7,3.5,...

    Text Solution

    |

  15. In a test in Mathematics, 20% of the students obtained ''first class''...

    Text Solution

    |

  16. The mean and standard deviation of a set of values are 5 and 2 respect...

    Text Solution

    |

  17. Calculate the mean and standard deviation of first natural numbers.

    Text Solution

    |

  18. The correlation coefficient computed from a set of 30 observation is 0...

    Text Solution

    |

  19. The mean age of a combined group of men and women is 25 yrs . If mean...

    Text Solution

    |

  20. Consider the following statements: 1. If 10 is added to each entry o...

    Text Solution

    |