


Similar Questions
Explore conceptually related problems
Recommended Questions
- The current through the coil in figure (i) varies as shown in figure (...
Text Solution
|
- The current i in an inductionn coil varies with time t according to th...
Text Solution
|
- The current i in an induction coil varies with time according to the g...
Text Solution
|
- The current through the coil in figure (i) varies as shown in figure (...
Text Solution
|
- The current is an induction coil varies with time t, according to the ...
Text Solution
|
- The current i in a coil varies with time as shown in the figure. The v...
Text Solution
|
- The current I and a coil varies with time as shows in the figure .Tghe...
Text Solution
|
- The current i in an induction coil varies with time t according to the...
Text Solution
|
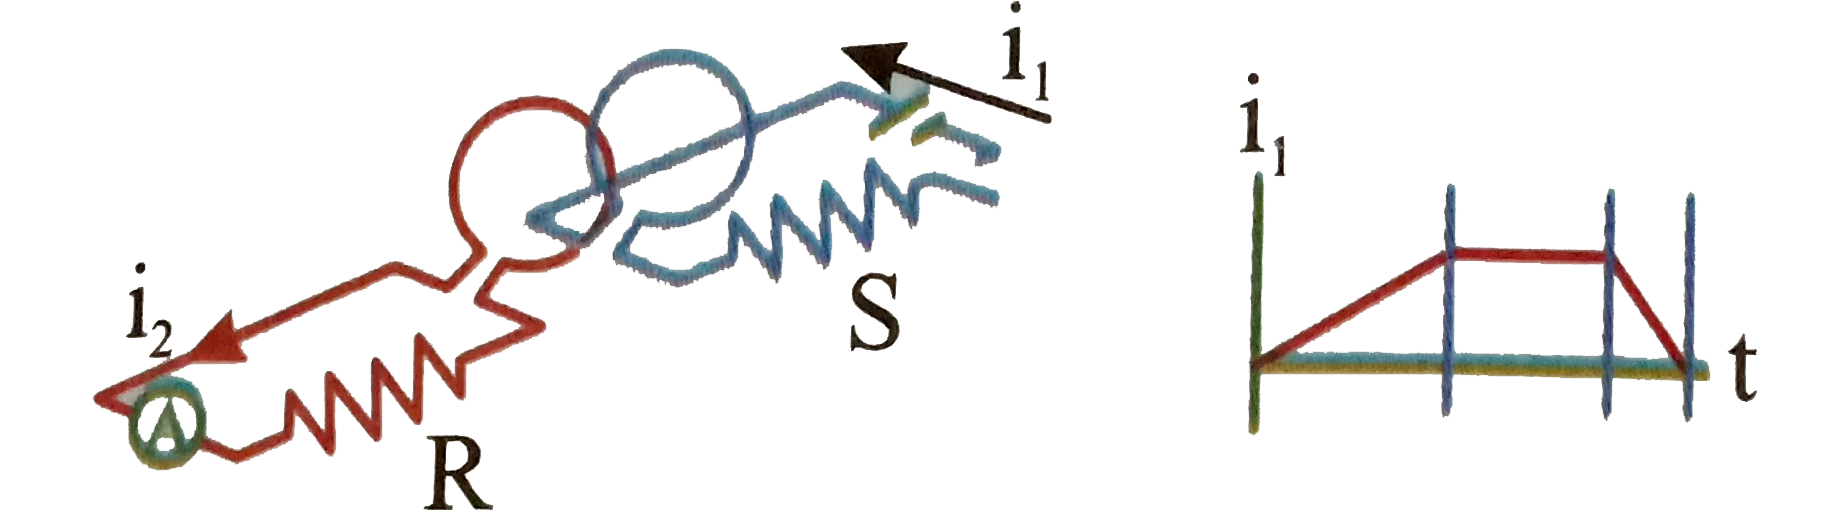
- The reading of ammeter shown in figure is
Text Solution
|