


Similar Questions
Explore conceptually related problems
Recommended Questions
- In photoelectric effect the slope of straight line graph between stopp...
Text Solution
|
- In photo electric effect, the slope of the straight line graph between...
Text Solution
|
- The slope of the stopping potential versus frequency graph for photoel...
Text Solution
|
- In photoelectric effect the slope of straight line graph between stopp...
Text Solution
|
- प्रकाश - वैधुत प्रभाव के प्रयोग में आपतित प्रकाश की आवृति (v ) तथा निर...
Text Solution
|
- Graph of incident freuency with stopping potential in photoelectric ef...
Text Solution
|
- In photoelectric effect the slope of straight line graph between stopp...
Text Solution
|
- In a photoelectric experiment, the reciprocal of the slope of the st...
Text Solution
|
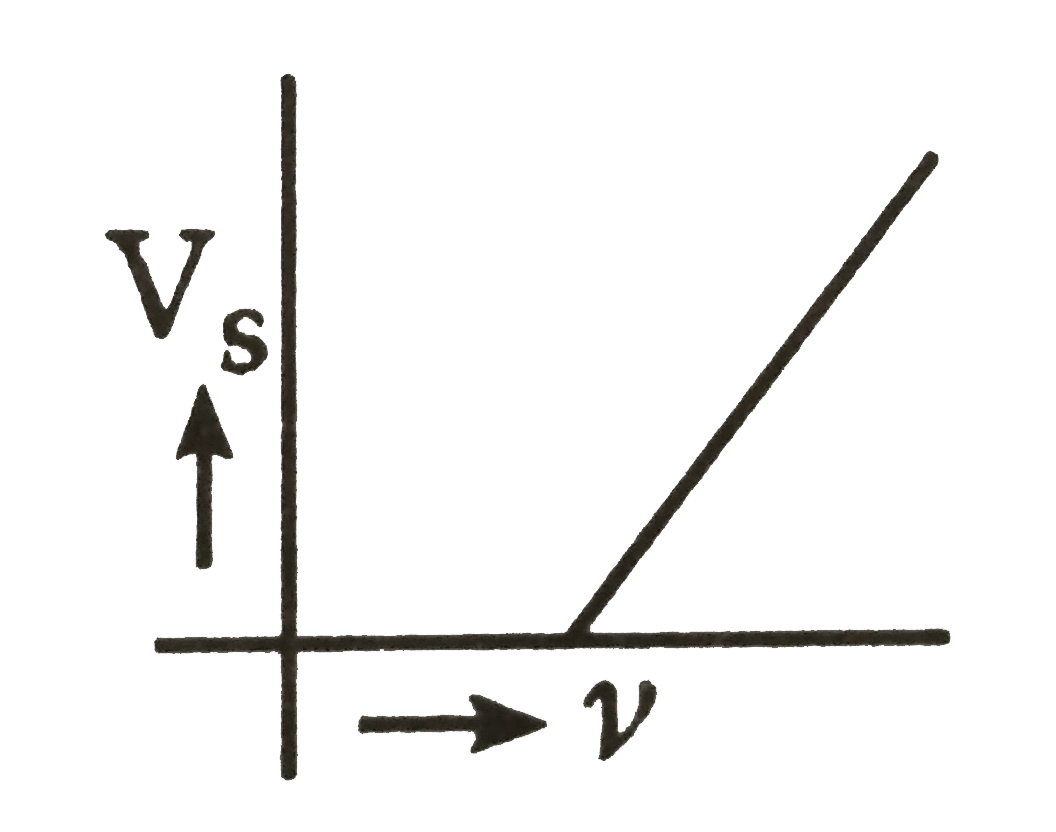
- Draw a graph to show the dependence of stopping potential on the frequ...
Text Solution
|