


Similar Questions
Explore conceptually related problems
Recommended Questions
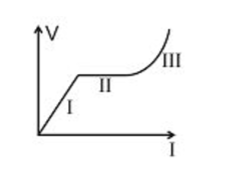
- Voltage V v/s I graph is shown in the figure.
Text Solution
|
- The variation of current (I) and voltage (V) is as shown in figure A. ...
Text Solution
|
- Find the current I & voltage V in the circuit shown.
Text Solution
|
- Velocity (v) versus displacement (s) graph of a particle moving in a s...
Text Solution
|
- In the V-T graph shown in figure match the following.
Text Solution
|
- Voltage V v/s I graph is shown in the figure.
Text Solution
|
- Find the current I & voltage V in the circuit shown.
Text Solution
|
- चित्र II.1 में दिखाए गये धारा I और वोल्टता V के बीच ग्राफ में ऋणा...
Text Solution
|
- Graph shown in figure is the relation between photo current (i) versus...
Text Solution
|