


Similar Questions
Explore conceptually related problems
Recommended Questions
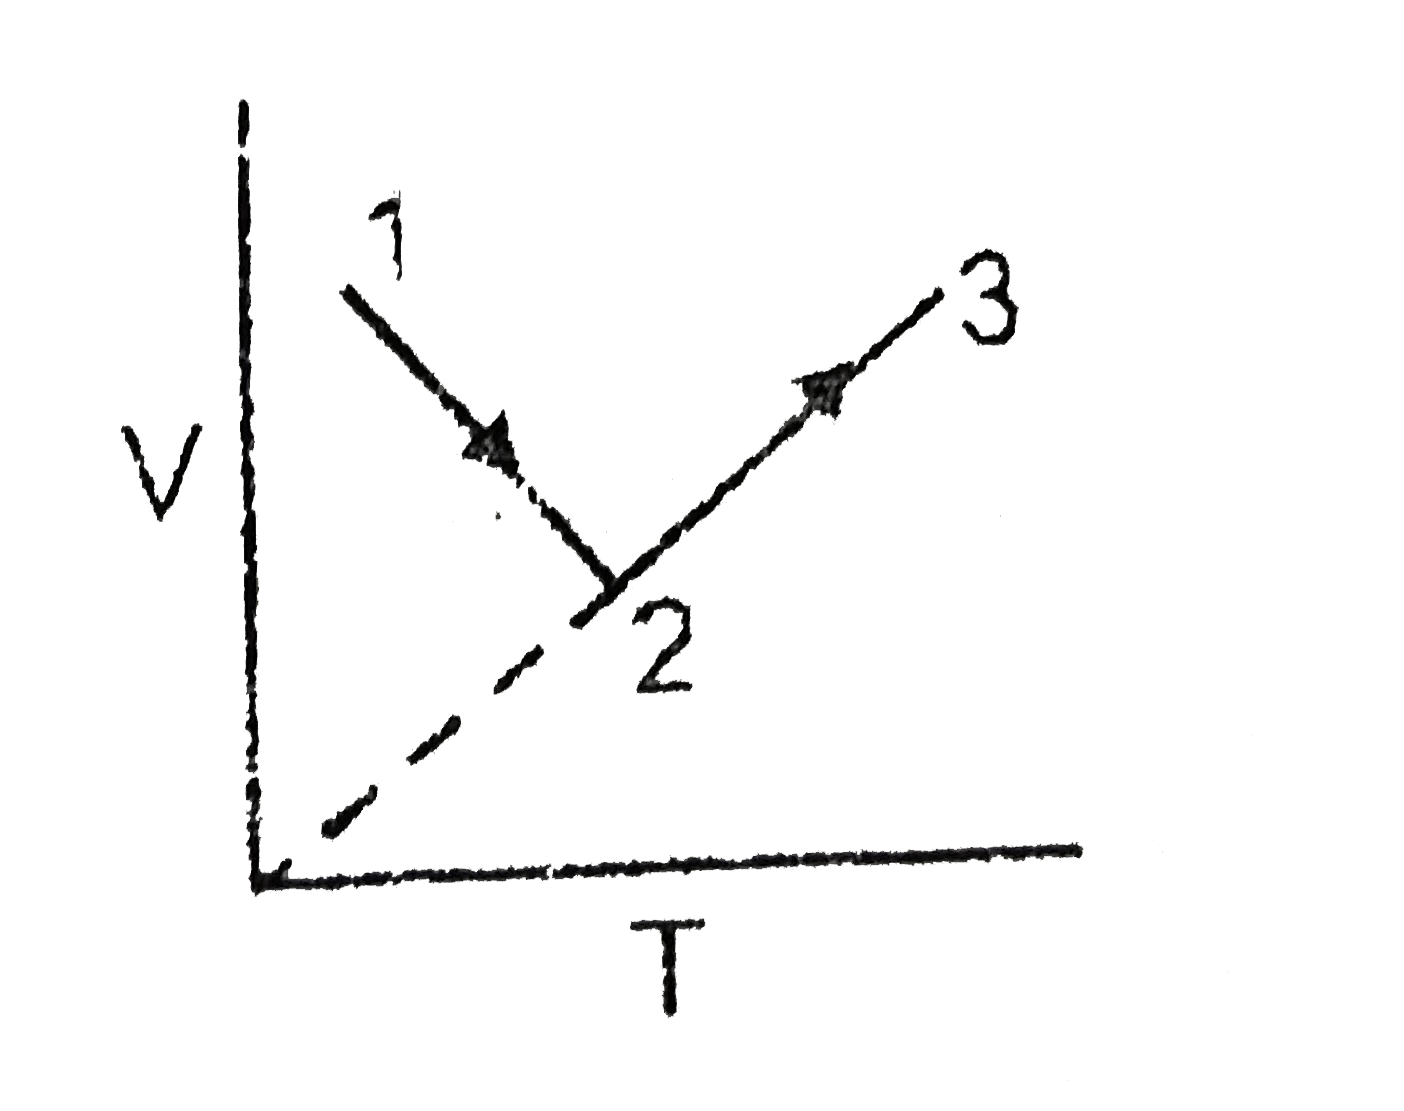
- Following graph is constucted for the fixed amount of the gas
Text Solution
|
- Draw a graph of log P and log (1//V) for a fixed amount of gas at cons...
Text Solution
|
- Draw a graph of log P vs log (1/V) for a fixed amount of a gas at cons...
Text Solution
|
- Consider the following (P-T) graph for a fixed mass of gas: Correct P-...
Text Solution
|
- Which one of these graphs for an ideal gas havinga fixed amount, the a...
Text Solution
|
- Which of following graphs correctly represent variation of alpha = (-(...
Text Solution
|
- For fixed amount of an ideal gas identify the incorrect graph :
Text Solution
|
- For fixed mass of an ideal gas a constant temperature. Which is correc...
Text Solution
|
- Following graph is constucted for the fixed amount of the gas
Text Solution
|