Text Solution
Verified by Experts


Topper's Solved these Questions
ELECTROMAGNETIC INDUCTION
KUMAR PRAKASHAN|Exercise Section C Ncert Exemplar Solution (Long Answer )|11 VideosELECTROMAGNETIC INDUCTION
KUMAR PRAKASHAN|Exercise Section D MCQs (From DARPAN Based on Textbook )|121 VideosELECTROMAGNETIC INDUCTION
KUMAR PRAKASHAN|Exercise Section C Ncert Exemplar Solution (MCQs)|16 VideosELECTRIC CHARGES AND FIELDS
KUMAR PRAKASHAN|Exercise SECTION D MCQS ASKED IN COMPETITIVE EXAMES (MCQS AKSED IN BOARD EXAM AND GUJCET)|14 VideosELECTROMAGNETIC WAVES
KUMAR PRAKASHAN|Exercise BOARD.S QUESTION PAPER MARCH - 2020 (PART - B) SECTION - C|5 Videos
Similar Questions
Explore conceptually related problems
KUMAR PRAKASHAN-ELECTROMAGNETIC INDUCTION-Section C Ncert Exemplar Solution (Short Answer )
- A magnetic field in a certain region is given by vecB=B0 cos (omegat) ...
Text Solution
|
- Consider a closed loop C in a magnetic field as shown in figure. The f...
Text Solution
|
- Find the current in the wire for the configuration shown in figure. Wi...
Text Solution
|
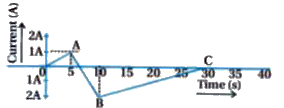
- A (current vs time) graph of the current passing through a solenoid is...
Text Solution
|
- There are two coils A and B separated by some distance. If a current o...
Text Solution
|