


Similar Questions
Explore conceptually related problems
Recommended Questions
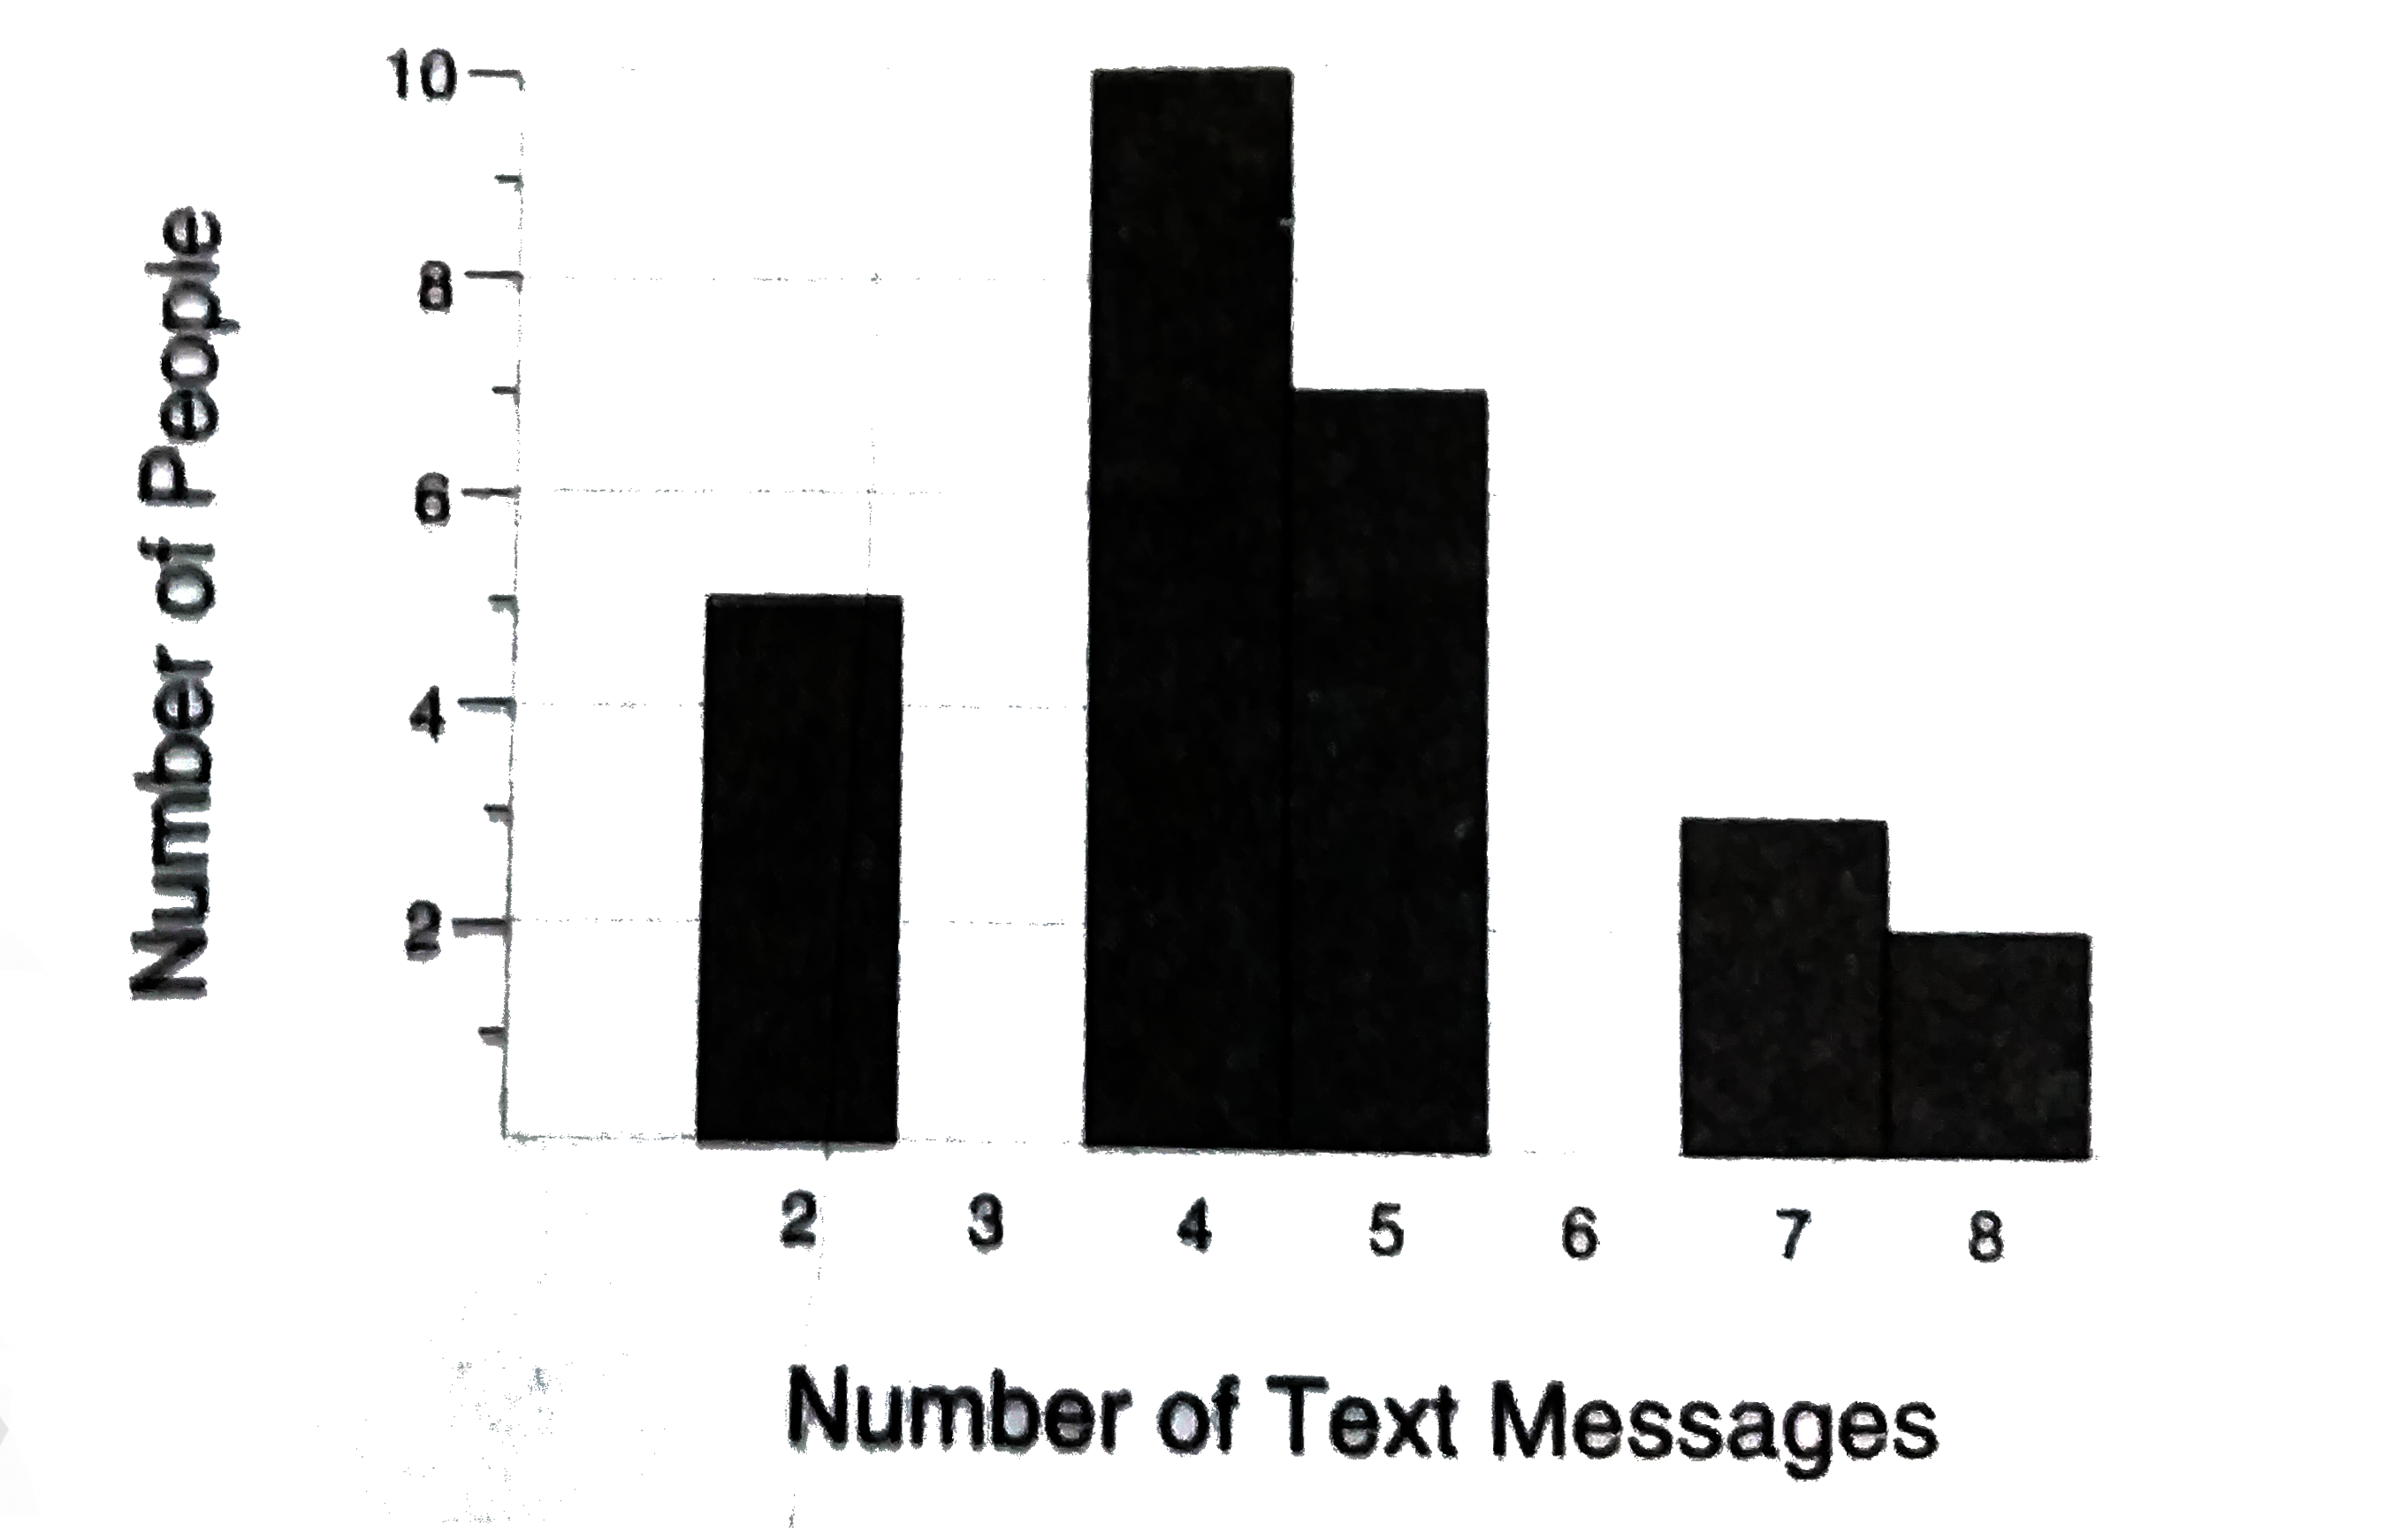
- The histogram above shows the number of mobile text message sent by a ...
Text Solution
|
- How many lines of symmetry does the above figure have ? <img src="http...
Text Solution
|
- Determine the point of symmetry of a regular hexagon. <img src="htt...
Text Solution
|
- Dtermine the images of the following figure about the given line : ...
Text Solution
|
- Match the following Column A to Column B
Text Solution
|
- Match the following Column A to Column B
Text Solution
|
- Match the following Column A to Column B
Text Solution
|
- Find the area of the figure given below.
Text Solution
|
- Calculate the volume of the given solid. ltimg src="https://d10lpgp6...
Text Solution
|