


Similar Questions
Explore conceptually related problems
Recommended Questions
- P – V graph of an ideal gas is as shown in the diagram . Work done by ...
Text Solution
|
- P - V diagram of an ideal gas is as shown in figure. Work done by the ...
Text Solution
|
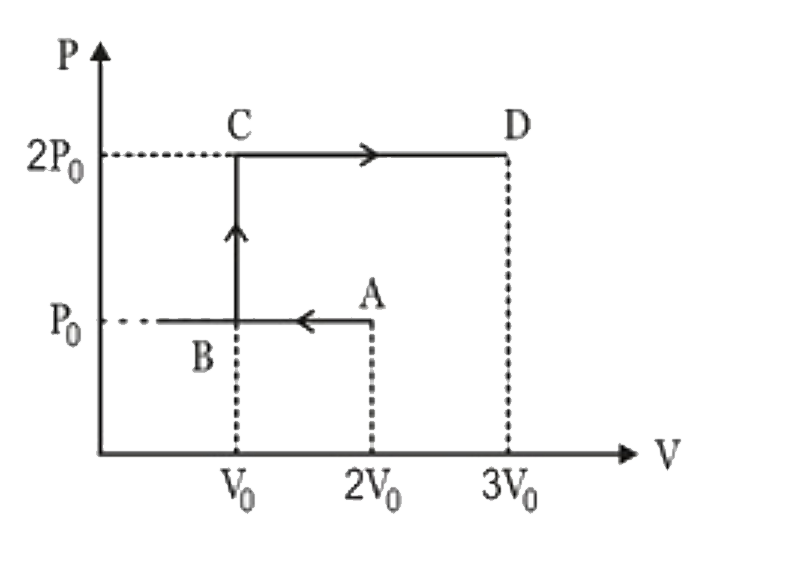
- An ideal gas underoges cyclic process of ABCDA as shown in Given P-V d...
Text Solution
|
- An ideal monoatomic gas is taken round the cycle ABCDA as shown in the...
Text Solution
|
- V-T graph of a process of monoatomic ideal gas is shown in figure. ...
Text Solution
|
- An ideal gas undergoes cyclic process ABCDA as shown in givend p-V dia...
Text Solution
|
- P – V graph of an ideal gas is as shown in the diagram . Work done by ...
Text Solution
|
- P - V diagram of an ideal gas is as shown in figure. Work done by the ...
Text Solution
|
- An ideal gas undergoes cyclic process ABCDA as shown in given P - V di...
Text Solution
|