


Similar Questions
Explore conceptually related problems
Recommended Questions
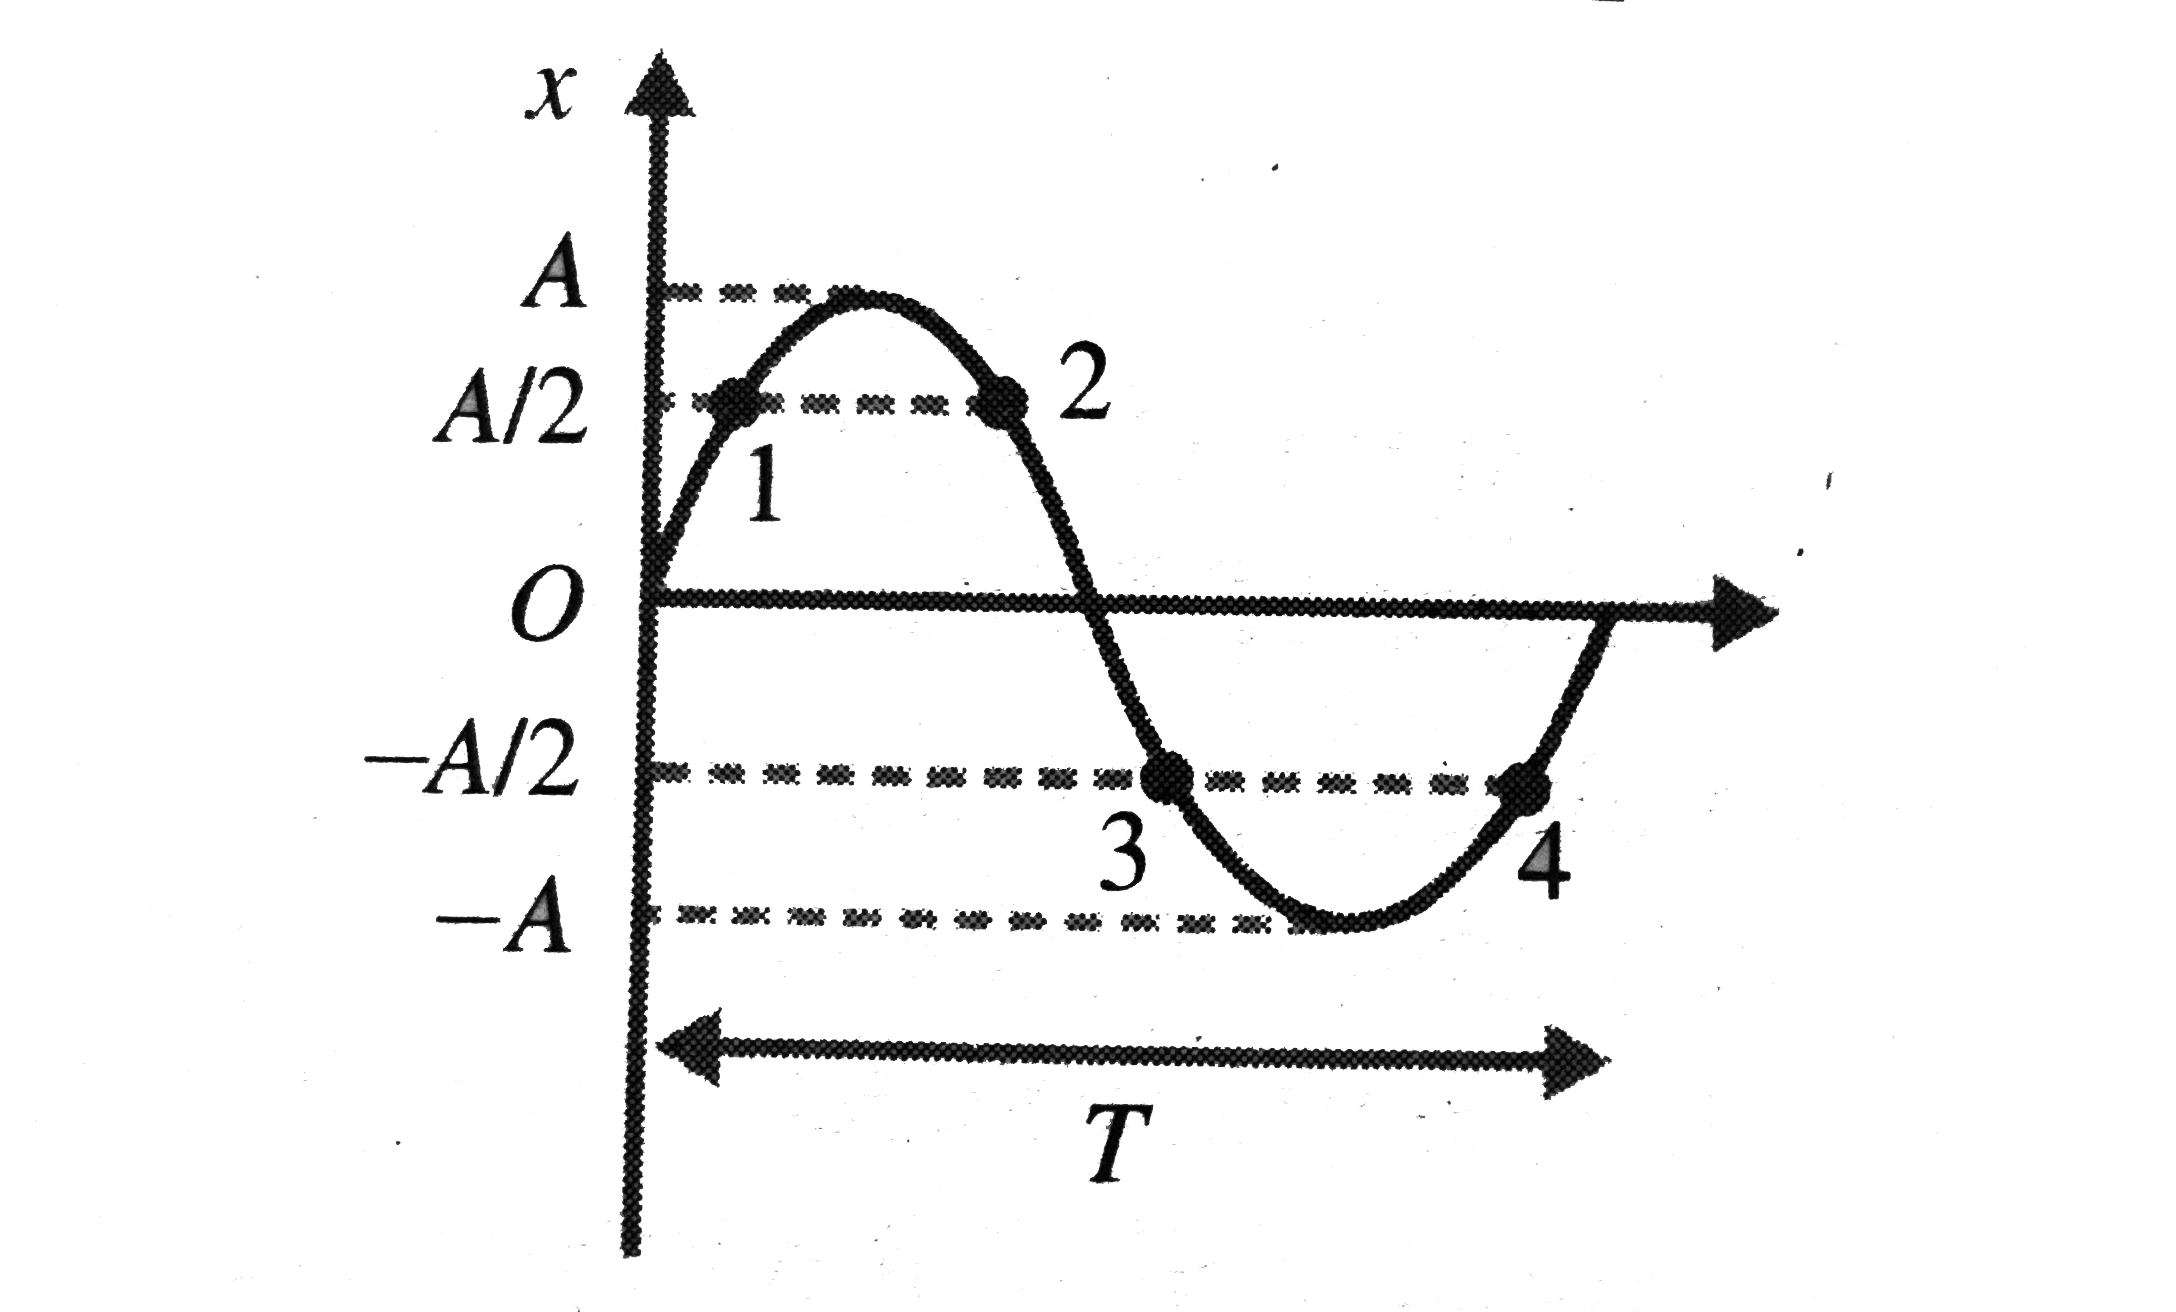
- Shows the displacement time graph of a partical excuting SHM with a ti...
Text Solution
|
- A partical excuting SHM with time period of 2 s : Find the time taken ...
Text Solution
|
- Shows the displacement time graph of a partical excuting SHM with a ti...
Text Solution
|
- A partical executes SHM with an amplltude of 10 cm and friquency 2 Hz,...
Text Solution
|
- i.The acceleration versus time graph of a partical SHM is shown in the...
Text Solution
|
- A partical is performing SHM of amplitude 'A' and time period 't'. Fin...
Text Solution
|
- A partical executing simple harmonic motion has amplitude of 1 m and t...
Text Solution
|
- The figure shows the displacement-time graph of a particle executing S...
Text Solution
|
- A partical is moving along the x-axis and its velocity-time graph is s...
Text Solution
|