


Similar Questions
Explore conceptually related problems
Recommended Questions
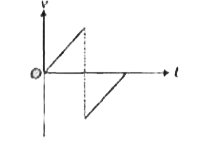
- The velocity (v) - time (t) graph for a particle moving along x - axis...
Text Solution
|
- The x-t graph of a particle moving along a straight line is shown in f...
Text Solution
|
- The x-t graph of a particle moving along a straight line is shown in f...
Text Solution
|
- The x-t graph of particle moving along a straight line is shown in fig...
Text Solution
|
- A car is moving on a straight road. The velocity of the car varies wit...
Text Solution
|
- The velocity -time (v - t) graph of a particle moving in a straight li...
Text Solution
|
- The velocity-time graph for a particle moving along X-axis is shown in...
Text Solution
|
- The velocity time graph for a particle moving along x-axis is shown in...
Text Solution
|
- A particle starts from the origin at time t = 0 and moves along the po...
Text Solution
|