


Similar Questions
Explore conceptually related problems
Recommended Questions
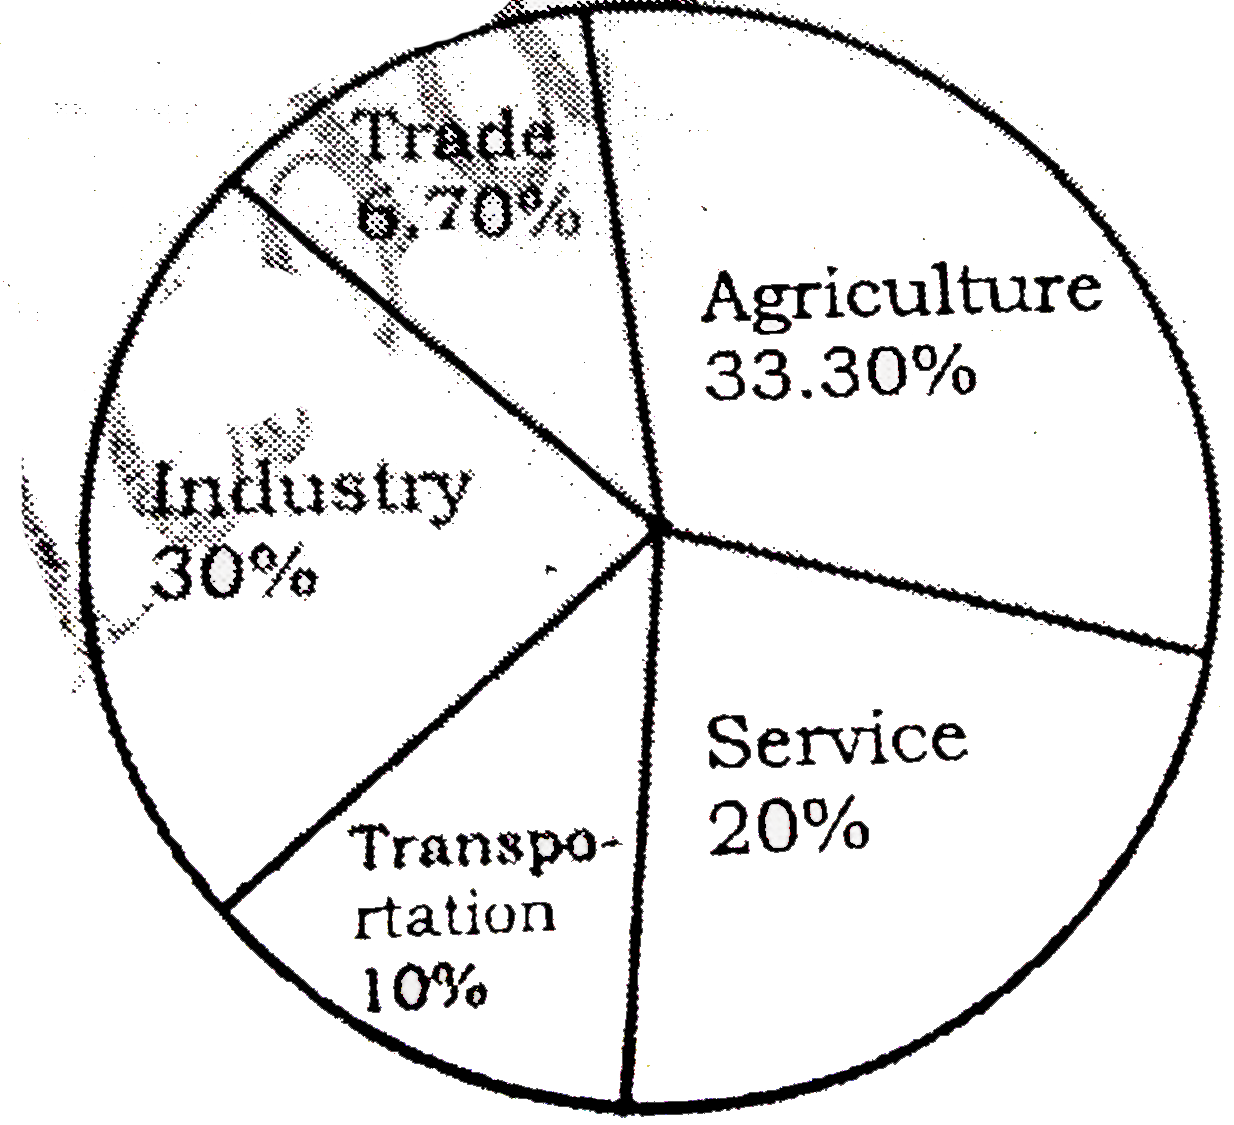
- निम्नलिखित पाई -चार्ट में विभीनन व्यवसायों को प्रतिशत दर्शाया गया है। ...
Text Solution
|
- चित्र में दिया गया वृत्त चार्ट मई -जून 2013 के दौरान वाहनों का केन्...
Text Solution
|
- चित्र में दिया गया वृत्त चार्ट मई -जून 2013 के दौरान वाहनों का केन्...
Text Solution
|
- निम्नलिखित में से कौन-सी संख्या (4)/(5) और (9)/(5) के बीच में नहीं है ...
Text Solution
|
- Study the following pie chart and table to answer the question.Total n...
Text Solution
|
- Study the following pie chart and table to answer the question.Total n...
Text Solution
|
- If the difference between 62% and 80% of a number is 198, then the dif...
Text Solution
|
- Study the pie-chart and the table carefully and answer the questions t...
Text Solution
|
- Study the chart and answer the questions: In which of the given year...
Text Solution
|