A
B
C
D
Text Solution
Verified by Experts
The correct Answer is:


Topper's Solved these Questions
BEHAVIOUR OF PERFECT GAS AND KINETIC THEORY
MTG GUIDE|Exercise TOPICWISE PRACTICE QUESTIONS (Kinetic Theory of Gases and Kinetic Interpretation of Temperature|11 VideosBEHAVIOUR OF PERFECT GAS AND KINETIC THEORY
MTG GUIDE|Exercise TOPICWISE PRACTICE QUESTIONS (Law of Equipartition of Energy and Application to Specific Heat capacities)|14 VideosBEHAVIOUR OF PERFECT GAS AND KINETIC THEORY
MTG GUIDE|Exercise AIPMT / NEET (MCQs)|11 VideosGRAVITATION
MTG GUIDE|Exercise AIPMT/NEET MCQS|32 Videos
Similar Questions
Explore conceptually related problems
MTG GUIDE-BEHAVIOUR OF PERFECT GAS AND KINETIC THEORY-TOPICWISE PRACTICE QUESTIONS (Equation of state of a Perfect gas)
- Pressure versus temperature graph of an ideal gas is shown in figure. ...
Text Solution
|
- A vessel has 6g of hydrogen at pressure P and temperature 500K. A smal...
Text Solution
|
- A cylinder contains 12 litres of oxygen at 20^(@)C and 15 atm pressur...
Text Solution
|
- If the pressure and the volume of certain quantity of ideal gas are ha...
Text Solution
|
- The temperature of a gas contained in a closed vessel increases by 1^(...
Text Solution
|
- From the relation PV = RT, calculate the value of the constant R for o...
Text Solution
|
- Two flasks R and S of volume V(1)andV(2) contain same gas at pressure ...
Text Solution
|
- A gas at 300 K has pressure 4 xx 10^(-10) N//m^(2). IF k = 1.38 xx 10^...
Text Solution
|
- Two containers of equal volume contain the same gas at pressure P(1) a...
Text Solution
|
- A balloon contains 1500 m^(3) of helium at 27^(@)C and 4 atmospheric p...
Text Solution
|
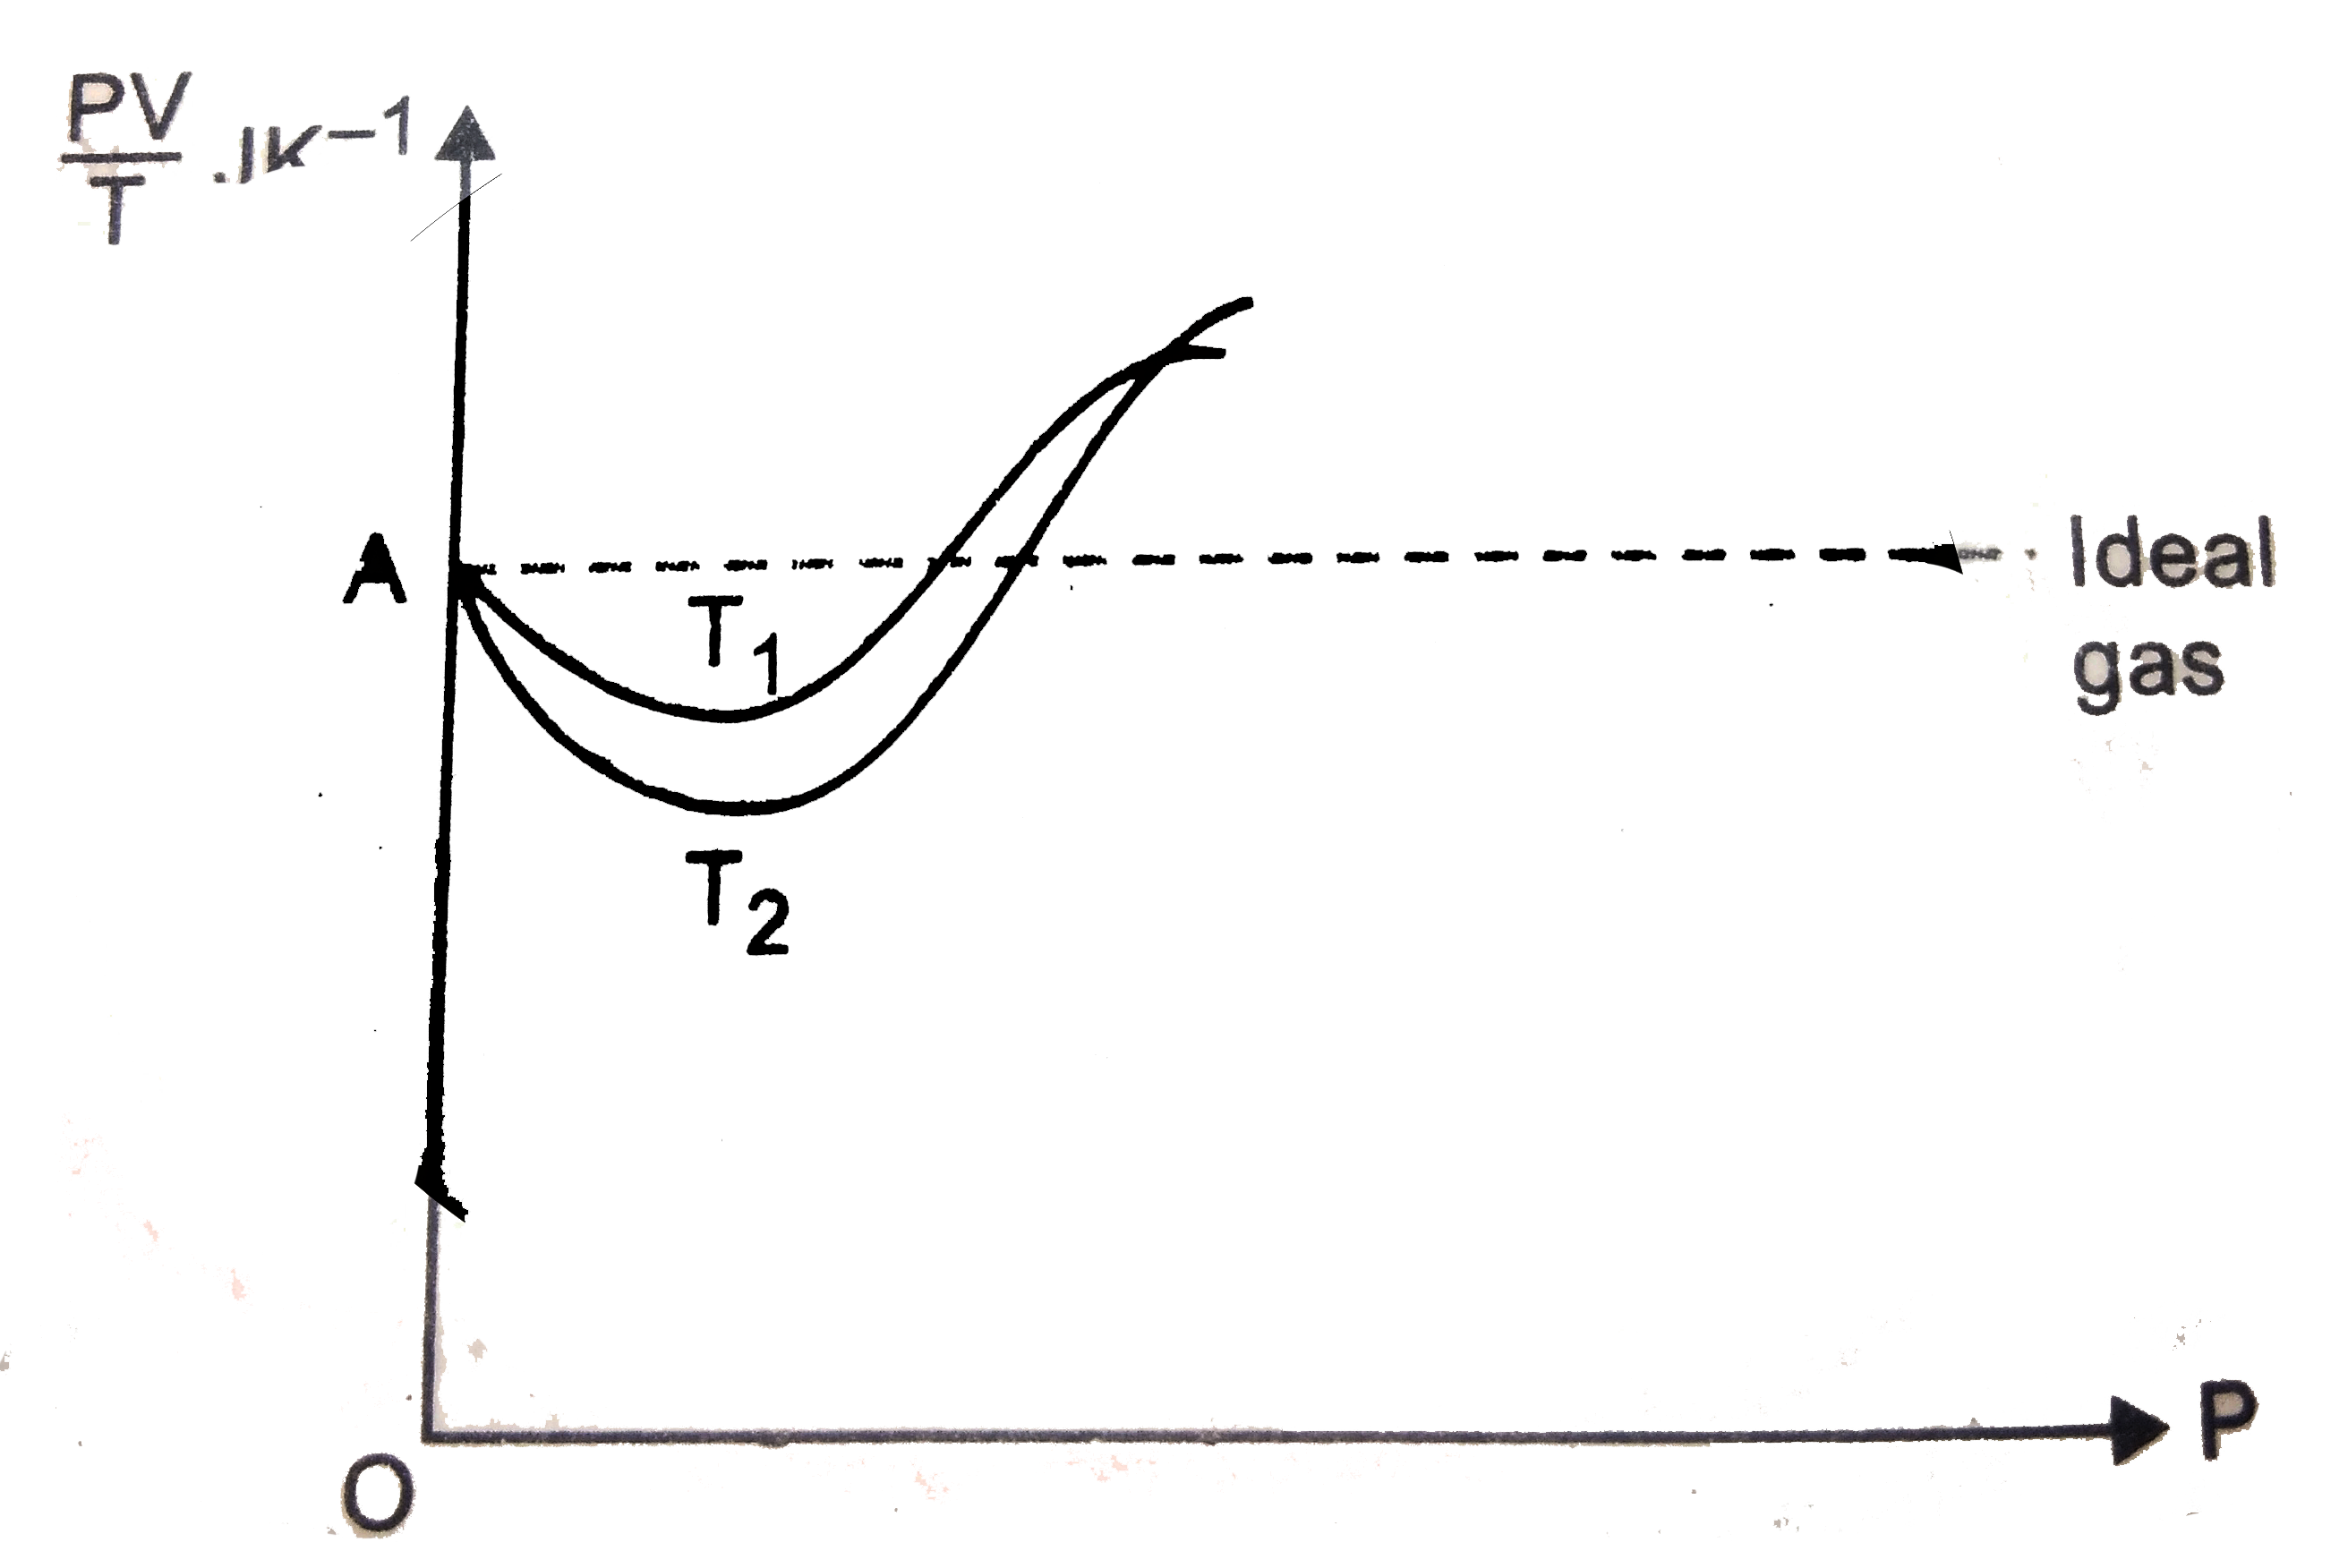
- Given is the graph between (PV)/T and P for 1 gm of oxygen gas at two ...
Text Solution
|
- Pressure versus temperature graph of an ideal gas of equal number of m...
Text Solution
|
- Aperfect gas at 27^(@) C is heated at constant pressure soas to duuble...
Text Solution
|
- A gas enclosed in a vessel has pressure P, volume V and absolute tempe...
Text Solution
|