Text Solution
Verified by Experts
The correct Answer is:


Topper's Solved these Questions
STATISTICS
ZEN PUBLICATION|Exercise TEXTUAL EXERCISES (Exercise 13.3)|7 VideosSTATISTICS
ZEN PUBLICATION|Exercise TEXTUAL EXERCISES (Exercise 13.4)|3 VideosSTATISTICS
ZEN PUBLICATION|Exercise TEXTUAL EXERCISES (Exercise 13.1)|9 VideosSOME APPLICATIONS OF TRIGONOMETRY
ZEN PUBLICATION|Exercise ADDITIONAL QUESTIONS (VALUE BASED QUESTIONS )|2 VideosSURFACE AREAS AND VOLUMES
ZEN PUBLICATION|Exercise ZEE ADDITIONAL QUESTIONS -HOTS [HIGHER ORDER THINKING SKILLS]-QUESTIONS|11 Videos
Similar Questions
Explore conceptually related problems
ZEN PUBLICATION-STATISTICS -TEXTUAL EXERCISES (Exercise 13.2)
- The following table shows the ages of the patients admitted in a hospi...
Text Solution
|
- The following data gives the information on the observed lifetimes (in...
Text Solution
|
- The following data gives the distribution of total monthly household e...
Text Solution
|
- The following distribution gives the state-wise teacher-student ratio ...
Text Solution
|
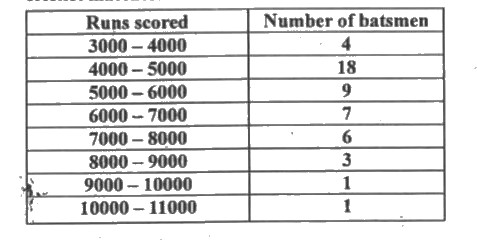
- The given distribution shows the number of runs scored by some top bat...
Text Solution
|
- A student noted the number of cars passing through a spot on a road fo...
Text Solution
|