


Topper's Solved these Questions
STATISTICS
ZEN PUBLICATION|Exercise ZEN ADDITIONAL QUESTIONS (SHORT ANSWER [SA] TYPE II QUESTIONS)|14 VideosSTATISTICS
ZEN PUBLICATION|Exercise ZEN ADDITIONAL QUESTIONS (LONG ANSWER [LA] TYPE QUESTIONS)|5 VideosSTATISTICS
ZEN PUBLICATION|Exercise ZEN ADDITIONAL QUESTIONS (VERY SHORT ANSWER [VSA] TYPE QUESTIONS)|10 VideosSOME APPLICATIONS OF TRIGONOMETRY
ZEN PUBLICATION|Exercise ADDITIONAL QUESTIONS (VALUE BASED QUESTIONS )|2 VideosSURFACE AREAS AND VOLUMES
ZEN PUBLICATION|Exercise ZEE ADDITIONAL QUESTIONS -HOTS [HIGHER ORDER THINKING SKILLS]-QUESTIONS|11 Videos
Similar Questions
Explore conceptually related problems
ZEN PUBLICATION-STATISTICS -ZEN ADDITIONAL QUESTIONS (SHORT ANSWER [SA] TYPE I QUESTIONS)
- Find the mean of the distribution.
Text Solution
|
- Calculate the mean of the following data:
Text Solution
|
- The arithmetic mean of the following frequency distribution is 25. Det...
Text Solution
|
- The weights of coffee in 70 packets are shown in the following table. ...
Text Solution
|
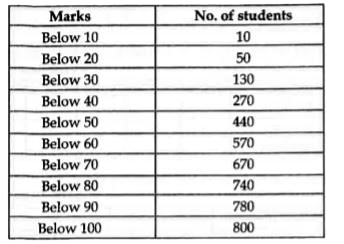
- The following table shows the cumulative distribution of marks of 800 ...
Text Solution
|
- Find the unknown entries a, b, c, d, e, and f in the following distrib...
Text Solution
|
- Weekly income of 600 families is tabulated below. Calculate the m...
Text Solution
|
- The following is the distribution of weight (in kg) of 40 persons. Con...
Text Solution
|
- Change the following distribution to a more than type distribution and...
Text Solution
|