


Similar Questions
Explore conceptually related problems
Recommended Questions
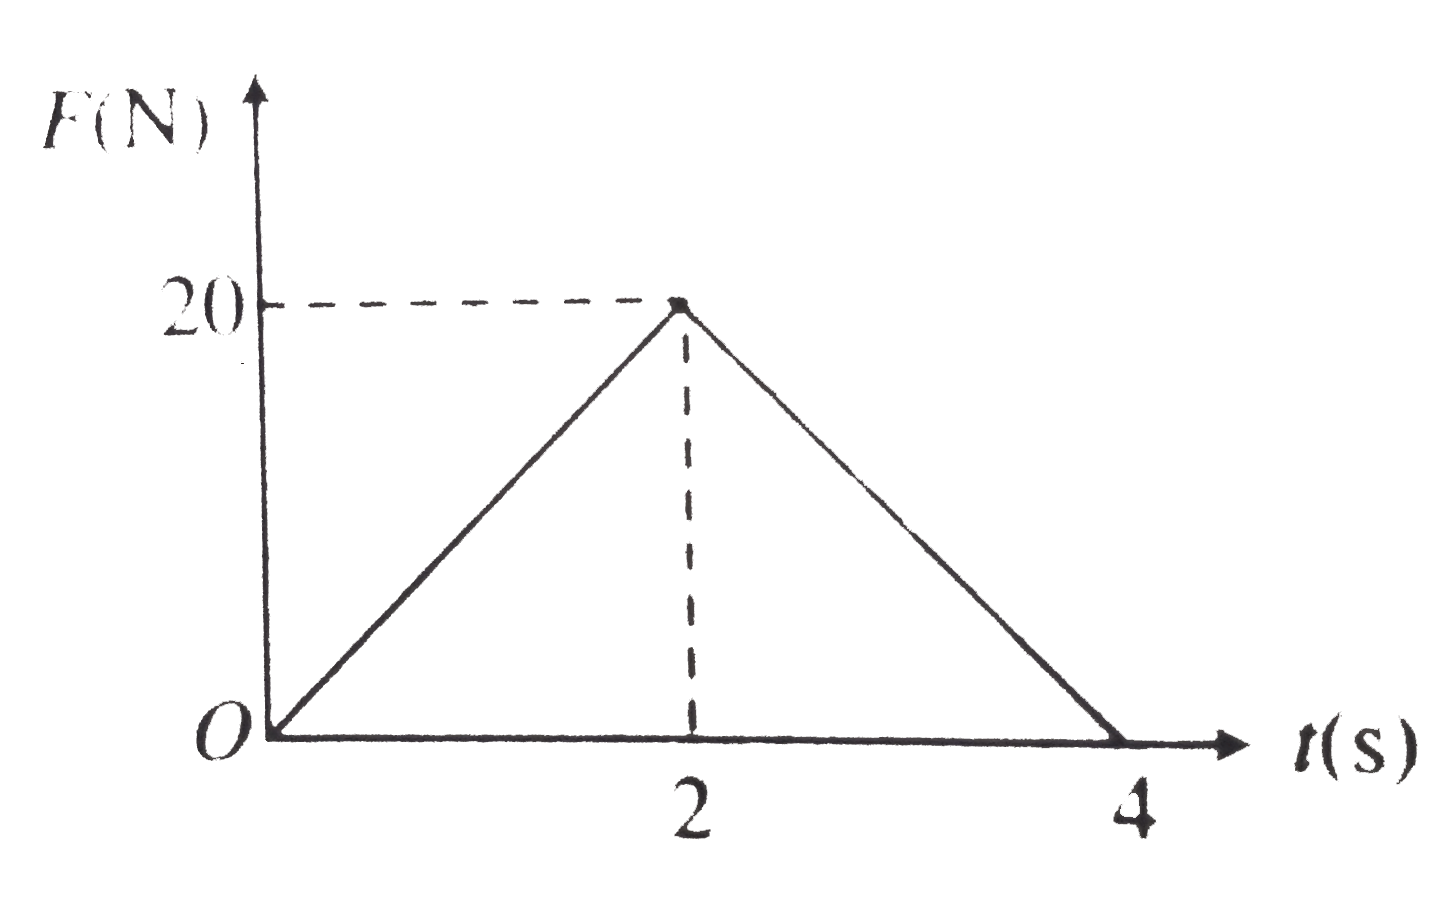
- Figure shows the variation of force acting on a boby with time. Assume...
Text Solution
|
- Figure shows the variation of force acting on a boby with time. Assume...
Text Solution
|
- The variation of temperature of a liquid with time is represented corr...
Text Solution
|
- The graph shown the variation with times t of the velocity v of an obj...
Text Solution
|
- The variation of momentum with time of one of the body in a two body c...
Text Solution
|
- The force F acting on a particle plotted against time t is shown in fi...
Text Solution
|
- The variation of potential energy U of a system is shown in figure. Th...
Text Solution
|
- In the figure a graph is plotted which shows the variation of the x- c...
Text Solution
|
- The variation of momentum with time of one of the body in a two body c...
Text Solution
|