


Similar Questions
Explore conceptually related problems
Recommended Questions
- A plot of P vs T for a given mass of gas at constant volume is a strai...
Text Solution
|
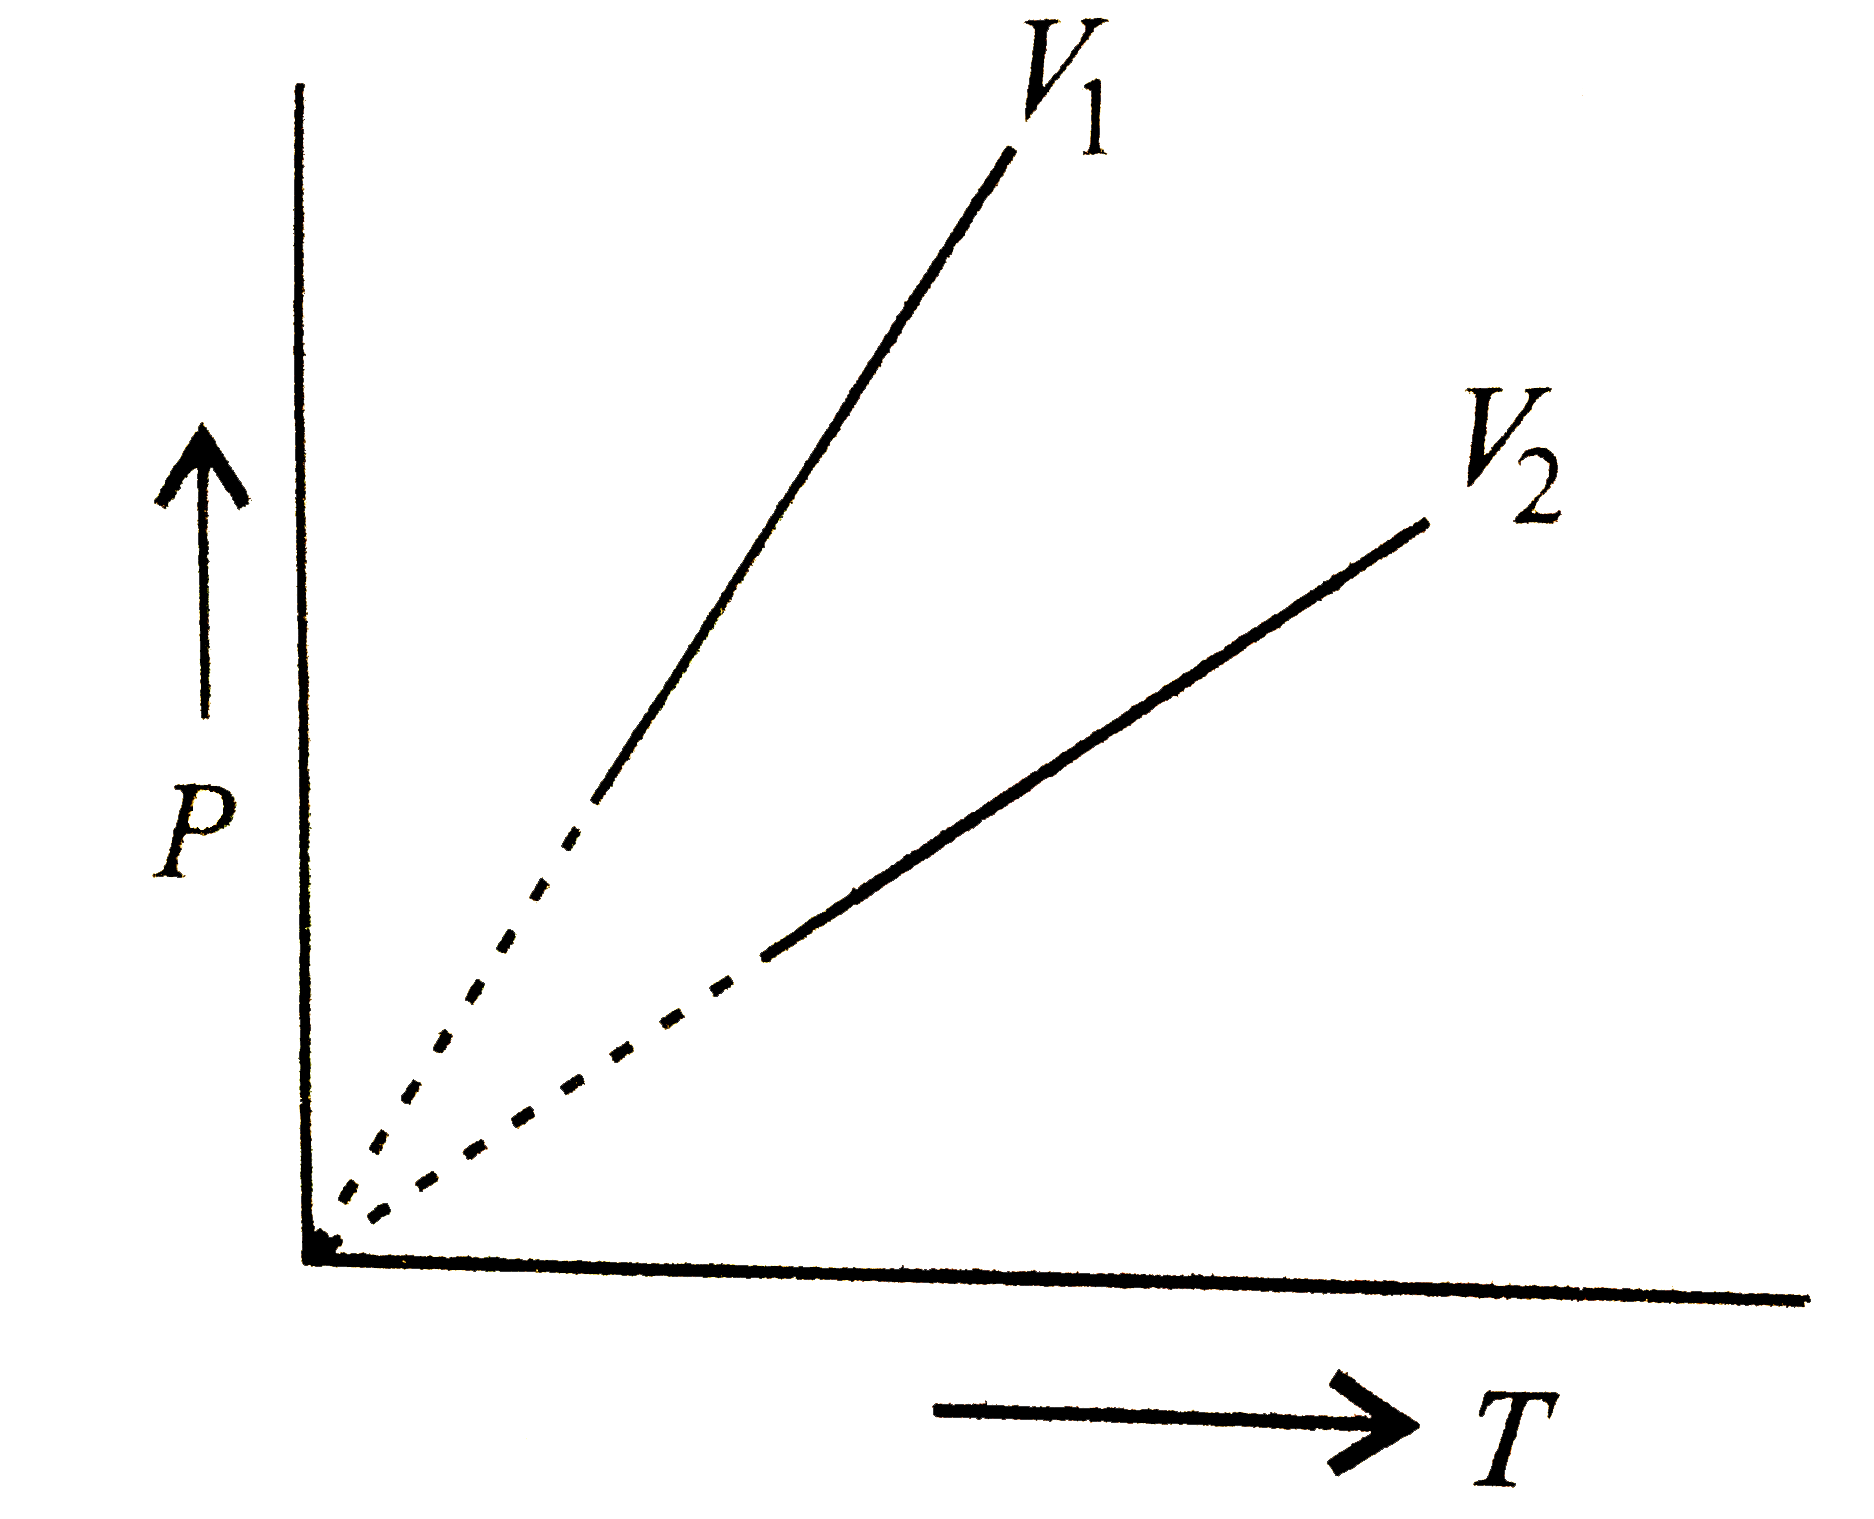
- The pressure p of a gas is plotted against its absolute temperature T ...
Text Solution
|
- For 1 mole of an ideal gas, a graph of pressure vs volume is plotted a...
Text Solution
|
- For 1 mole of an ideal gas, a graph of pressure vs volume is plotted a...
Text Solution
|
- The pressure P of a gas is plotted against its absolute temperature T ...
Text Solution
|
- V vs T curves at constant pressure P(1) and P(2) for an ideal gas are ...
Text Solution
|
- STATEMENT-1 : Plot of P vs 1/V (volume) is a straight line for an idea...
Text Solution
|
- A plot of P vs T for a given mass of gas at constant volume is a strai...
Text Solution
|
- Will the nature of the following graphical presentations for a given m...
Text Solution
|