


Similar Questions
Explore conceptually related problems
Recommended Questions
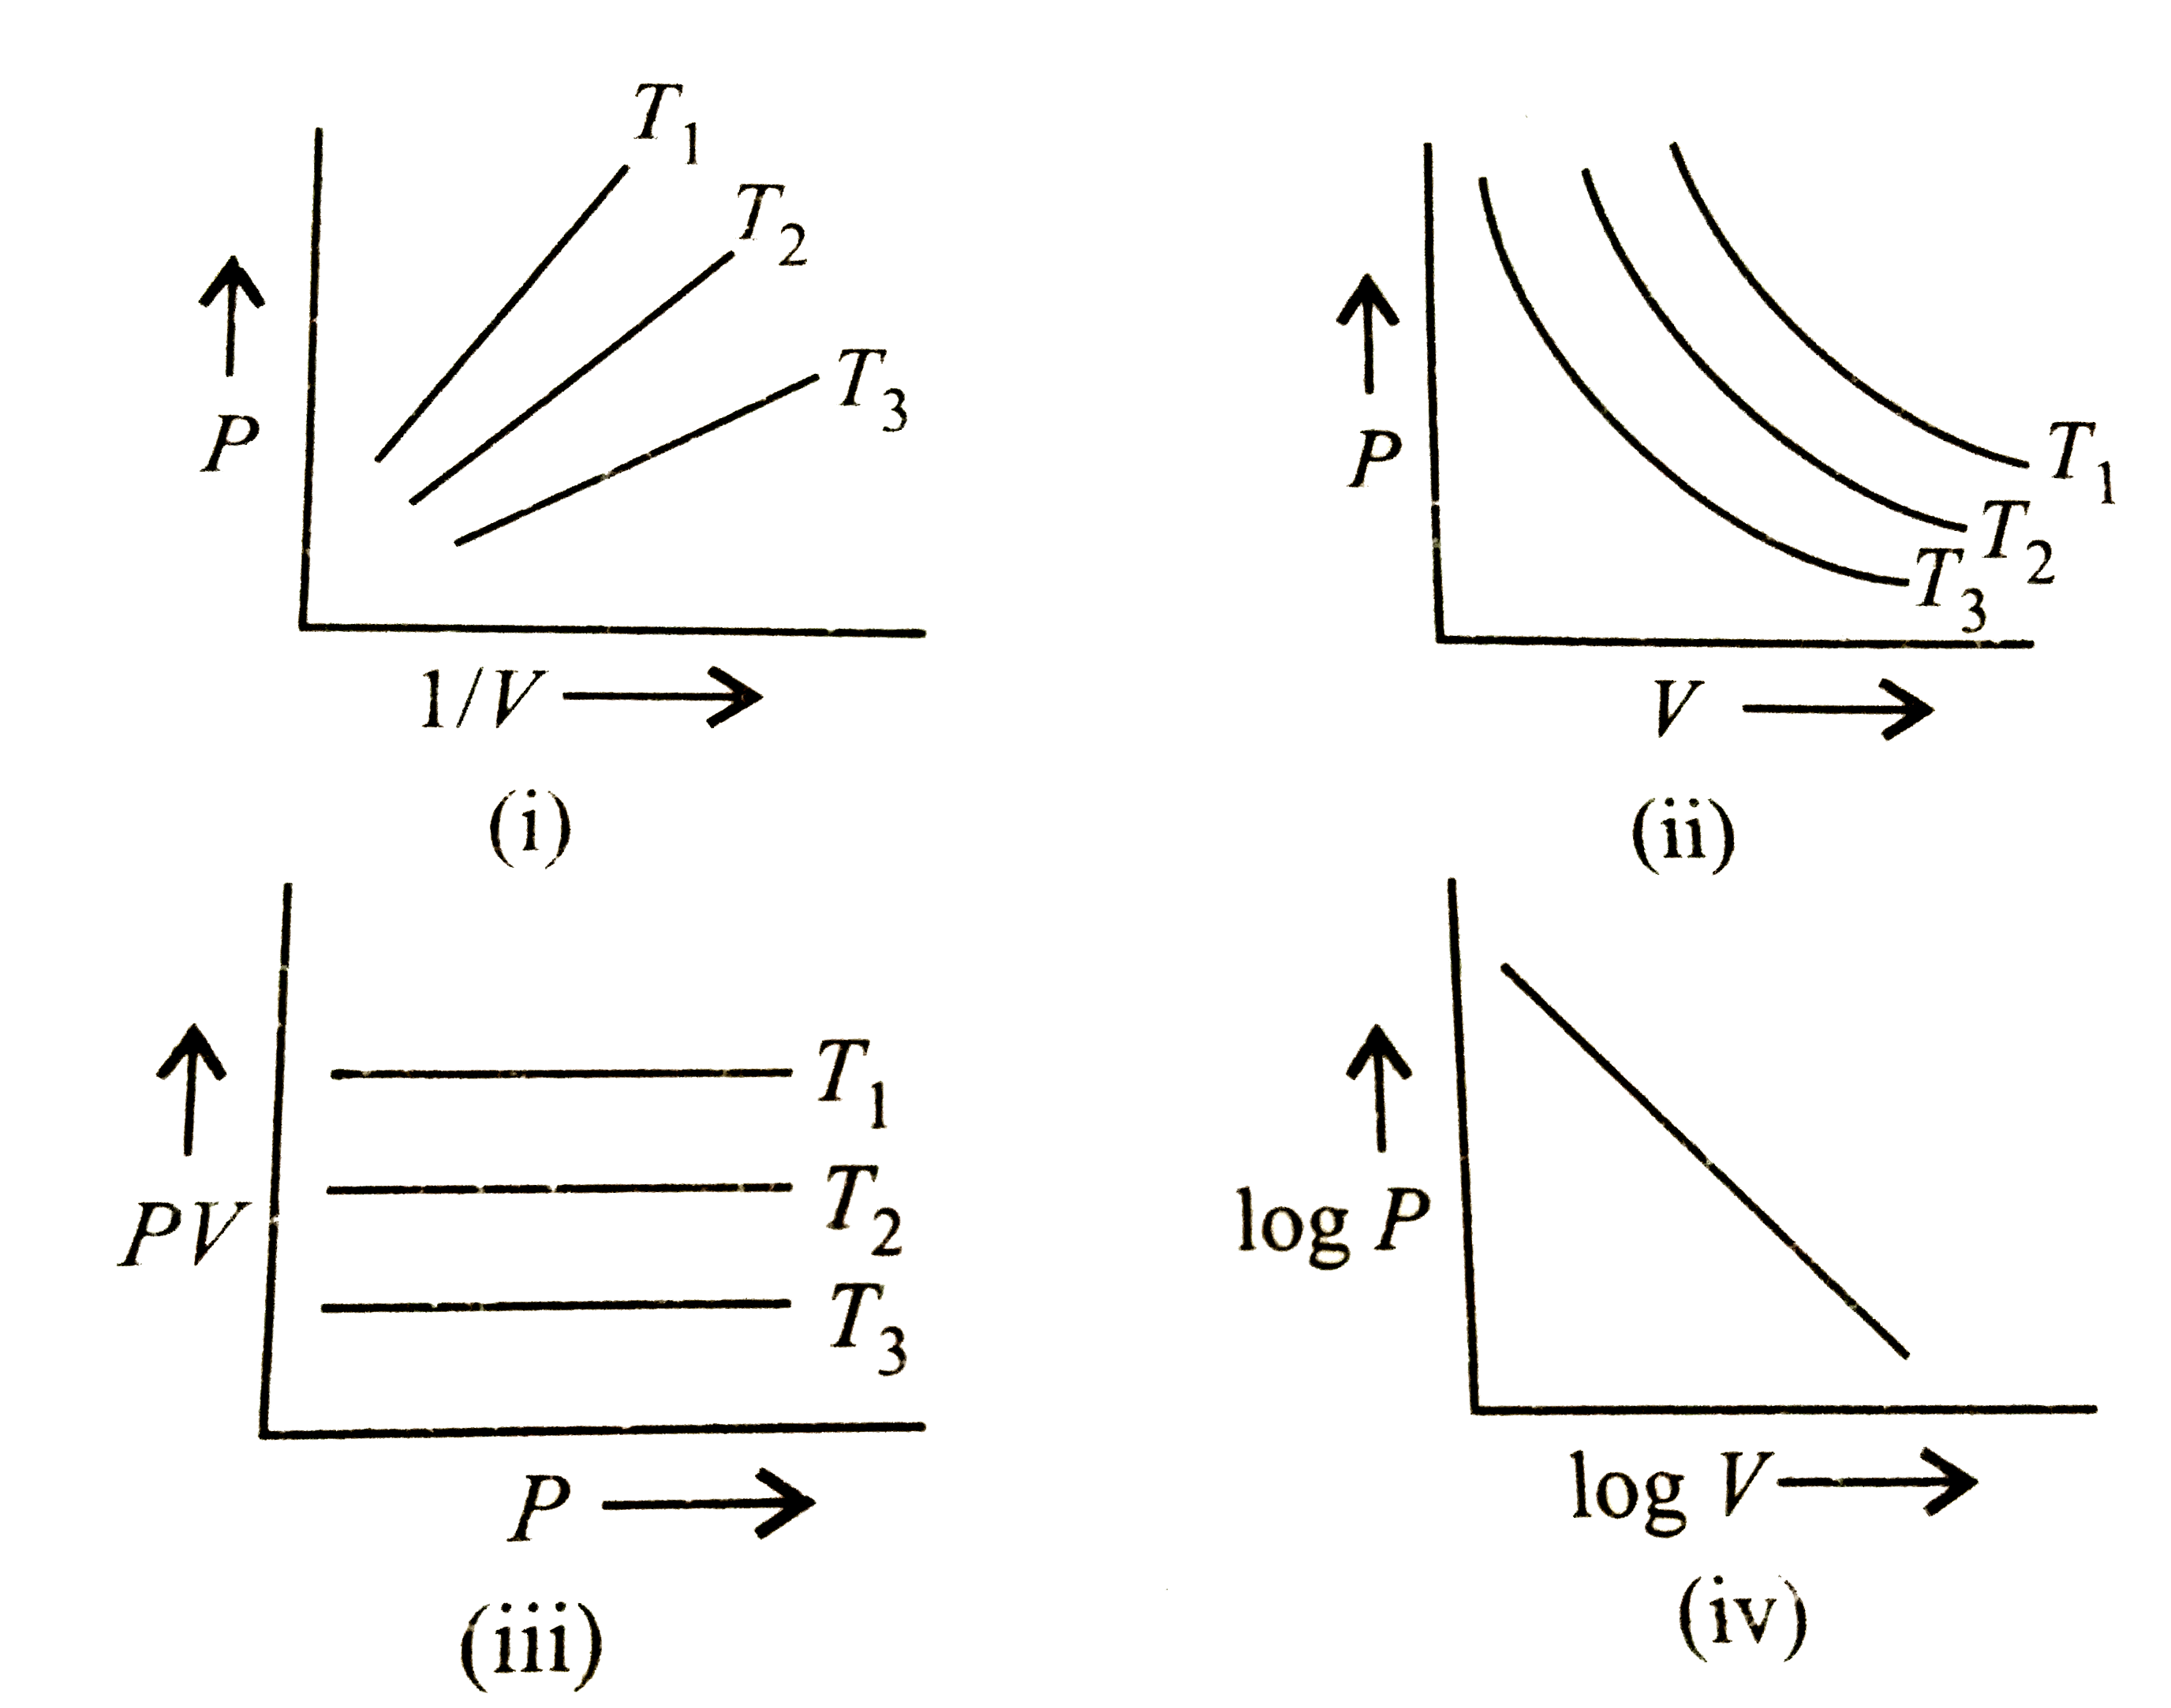
- Graphs between pressure and volume are plotted at different temperatur...
Text Solution
|
- Shown below are the black body radiation curves at temperature T(1) an...
Text Solution
|
- (Figure) Shows three isothermal curves at temp T(1), T(2) and T(3) T...
Text Solution
|
- In following isothermal graphs A, B and C at temperatures T(1), T(2) a...
Text Solution
|
- Examine the following plots and predict whether in (i) P(1) lt P(2) "a...
Text Solution
|
- Graphs between pressure and volume are plotted at different temperatur...
Text Solution
|
- At two different temperature T(1) and T(2), (T(2) gt T(1)) , draw two ...
Text Solution
|
- Isothermal curves for a given mass of gas are shown at two different t...
Text Solution
|
- Graph between pressure and volume are plotted at different temperature...
Text Solution
|