


Similar Questions
Explore conceptually related problems
Recommended Questions
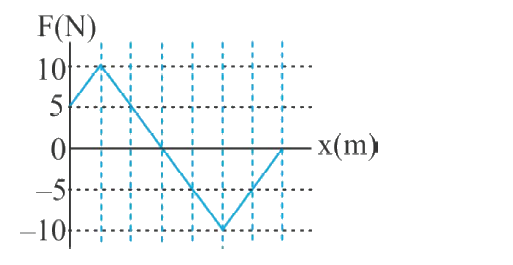
- The figure shows the force (F) versus displacement (s) graph for a par...
Text Solution
|
- A particle starting from rest. Its acceleration (a) versus time (t) is...
Text Solution
|
- Figure shows the graph of acceleration of particle as a function of ti...
Text Solution
|
- The maximum speed of a particle executing S.H.M. is 1 m/s and its maxi...
Text Solution
|
- A particle of mass m initially moving with speed v.A force acts on the...
Text Solution
|
- A particle of mass m initially at rest. A variabl force acts on the pa...
Text Solution
|
- The maximum speed of a particle in SHM is given by mA=V(m) . The avera...
Text Solution
|
- The figure shows the force (F) versus displacement (s) graph for a par...
Text Solution
|
- एक 0.2 किग्रा द्रव्यमान का कण एक बल के अंतर्गत, जो एक नियत शक्ति 0.5 ...
Text Solution
|