


Similar Questions
Explore conceptually related problems
Recommended Questions
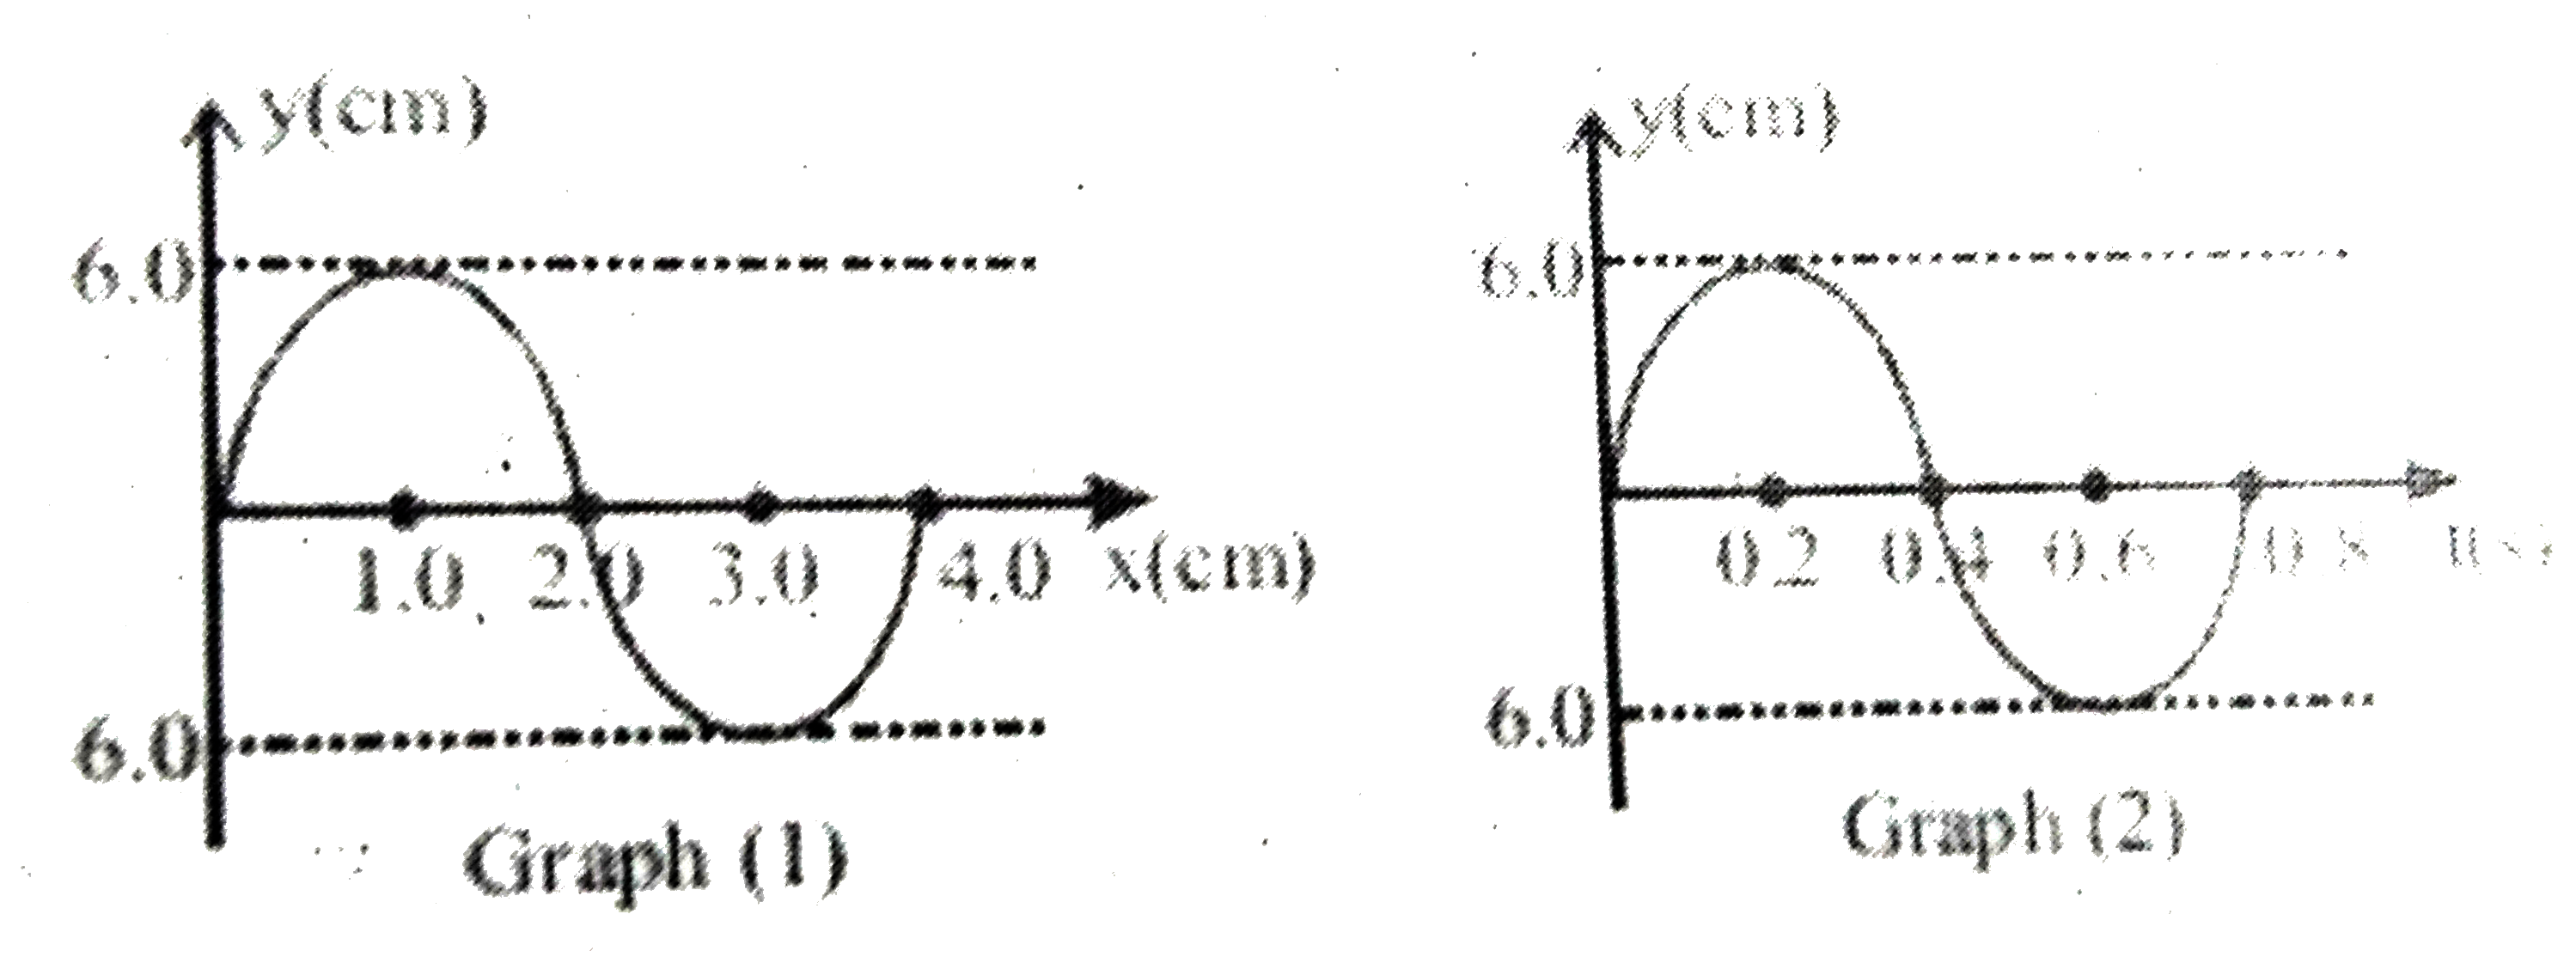
- graphs of the same harmonic wave are shown below. The graph (1) on the...
Text Solution
|
- The same progressive wave is represented by two graphs I and II. Graph...
Text Solution
|
- A sinusoidal wave having wavelength of 6 m propagates along positive x...
Text Solution
|
- the same progressive wave is reprsented by two group I and II. Graoup ...
Text Solution
|
- The same progressive wave is represented by two graphs I and II . Grap...
Text Solution
|
- graphs of the same harmonic wave are shown below. The graph (1) on the...
Text Solution
|
- Displacement - time graphs for two waves, wave - 1 and wave - 2 are sh...
Text Solution
|
- The displacement x of a particle with a function of time t is shown in...
Text Solution
|
- the same progressive wave is reprsented by two group I and II. Graoup ...
Text Solution
|