 .
.


Similar Questions
Explore conceptually related problems
Recommended Questions
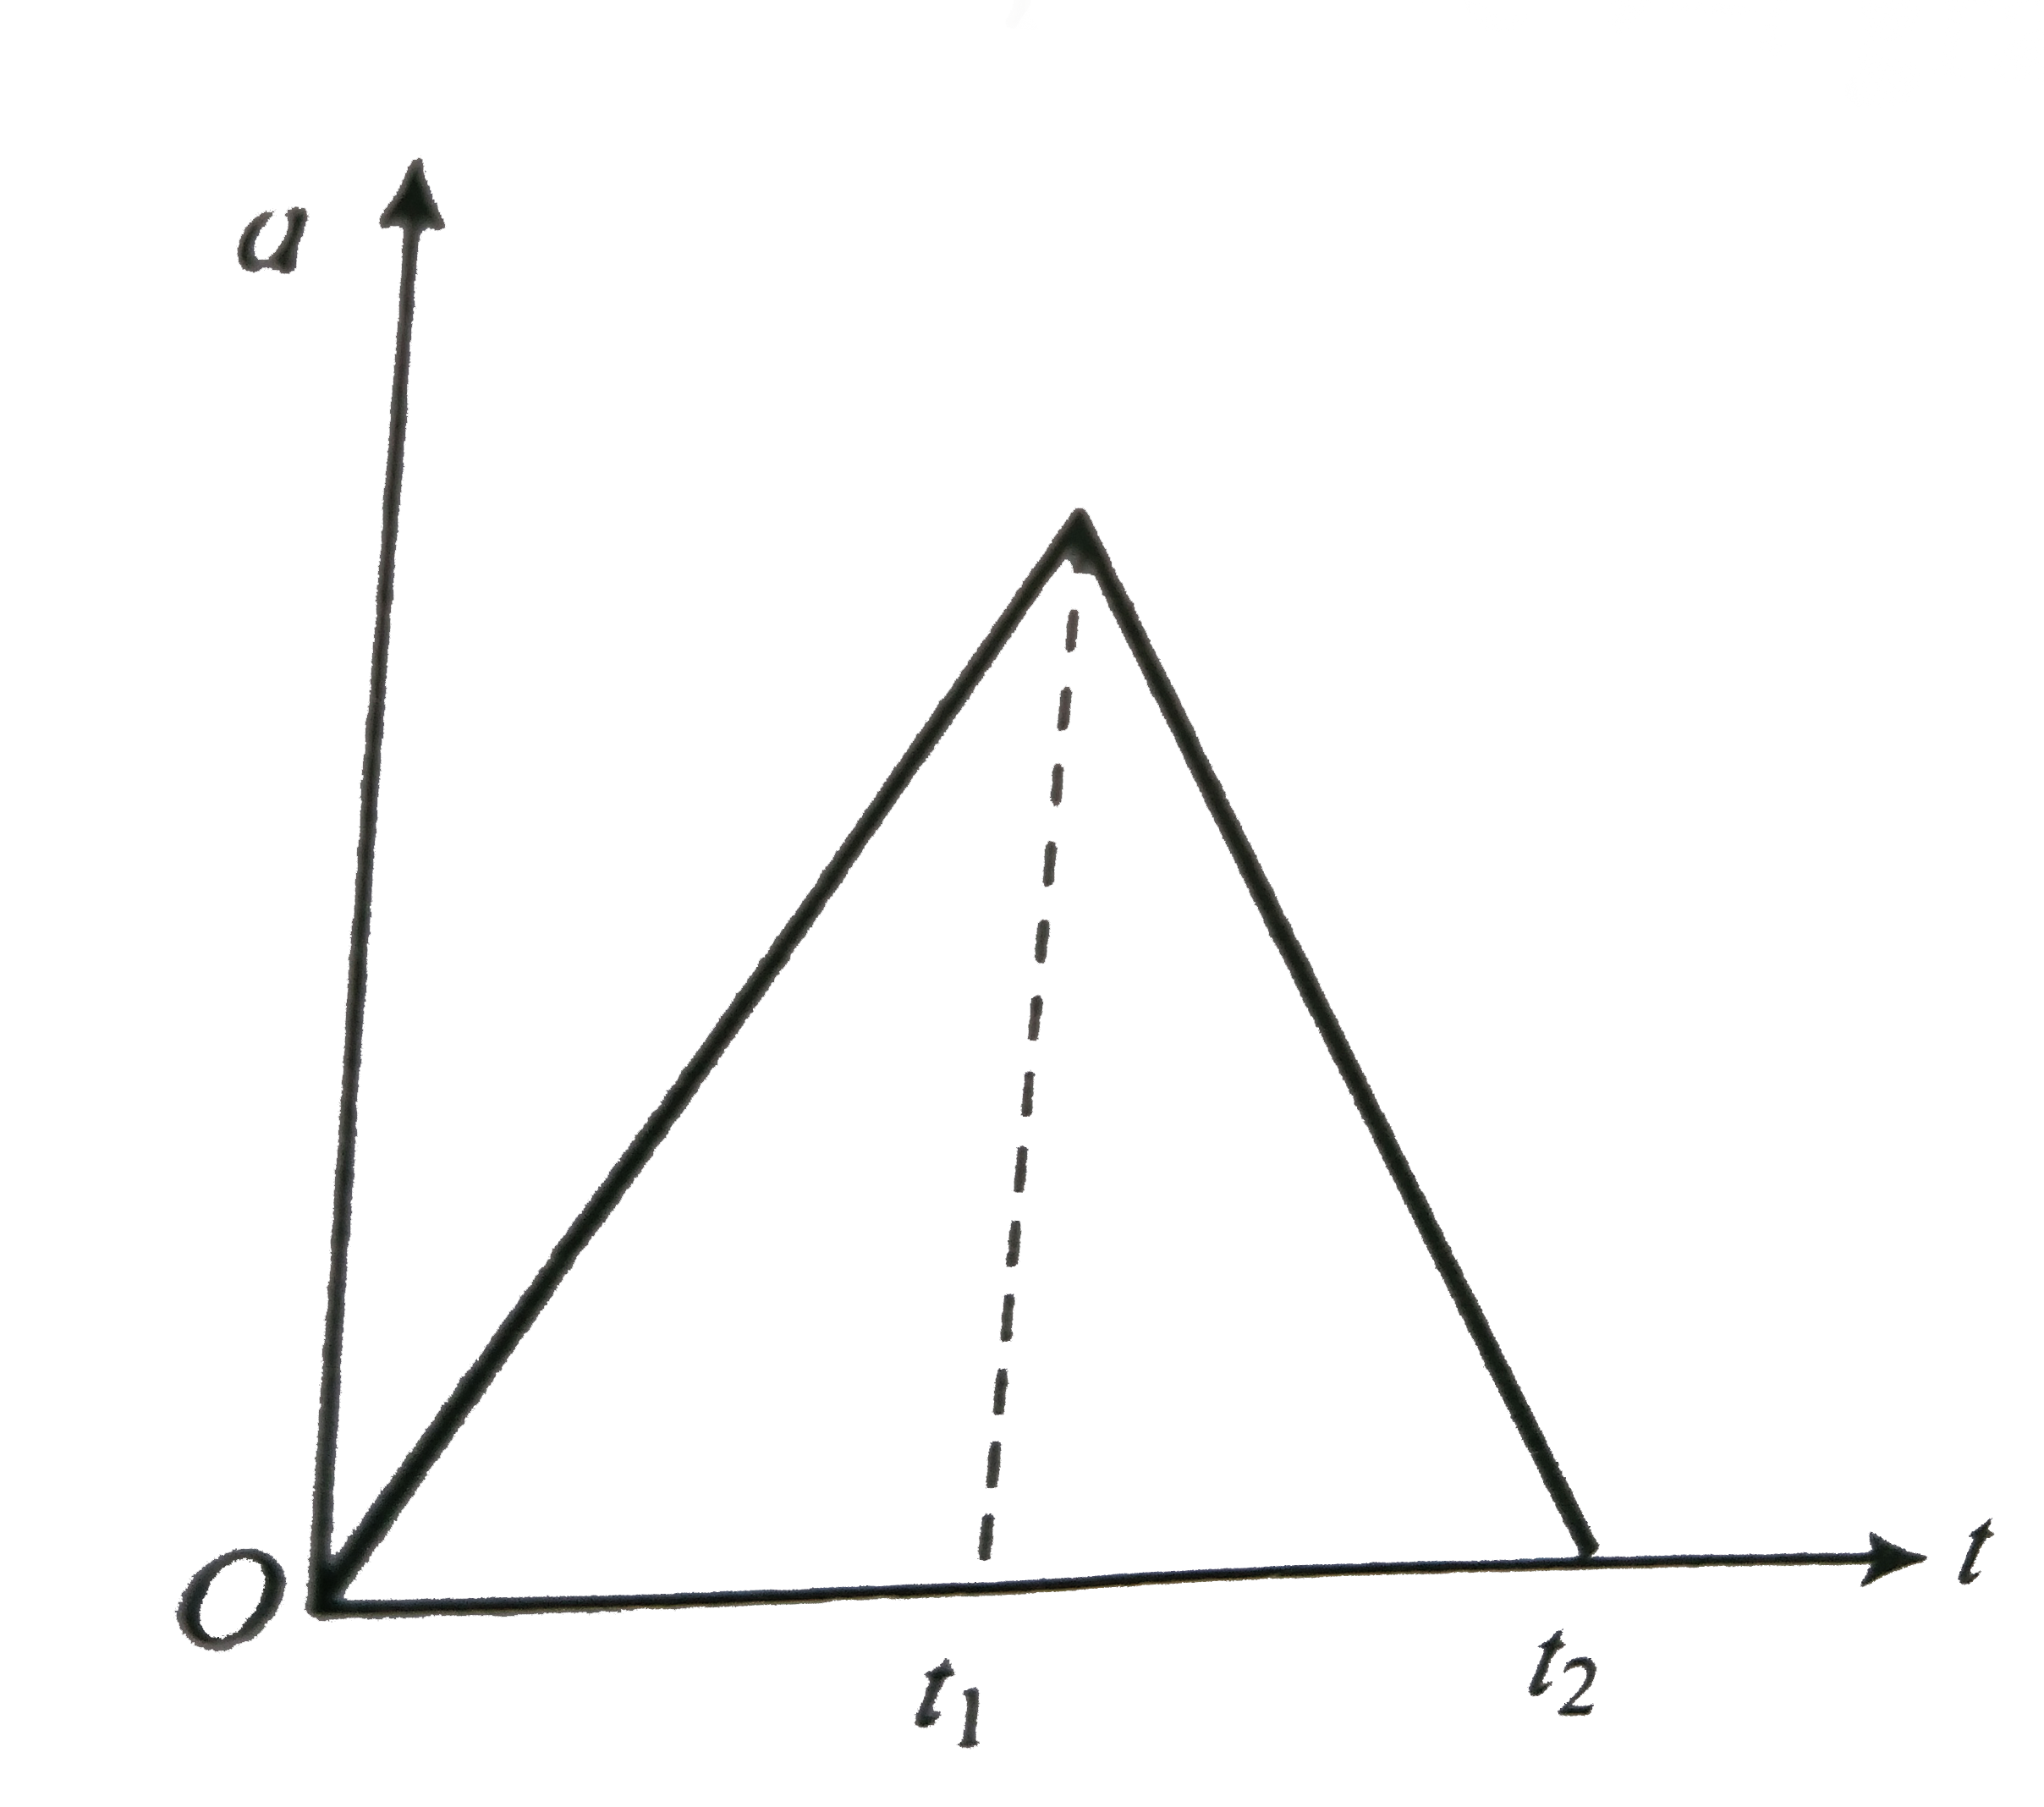
- The acceleration versus time graph of a particle is shown in. The resp...
Text Solution
|
- The acceleration versus time graph of a particle moving along a straig...
Text Solution
|
- The acceleration versus time graph of a particle is shown in the figur...
Text Solution
|
- For a particle moving on a straight lint the variation of acceleration...
Text Solution
|
- A particle starts to move along a straight line. The acceleration vers...
Text Solution
|
- Velocity (v) versus displacement (s) graph of a particle moving in a s...
Text Solution
|
- The velocity -time (v - t) graph of a particle moving in a straight li...
Text Solution
|
- Acceleration versus time graph of a particle moving in a straight line...
Text Solution
|
- A graph of acceleration versus time of a particle starting from rest a...
Text Solution
|