


Similar Questions
Explore conceptually related problems
Recommended Questions
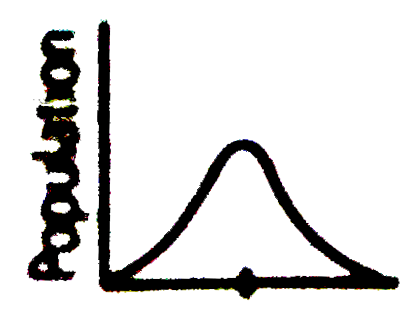
- The given graph shows the range of variation among population members ...
Text Solution
|
- The given graph shows the range of variation among population members ...
Text Solution
|
- Study the charactristics of a population represented in the graphs bel...
Text Solution
|
- Study the charactristics of a population represented in the graphs bel...
Text Solution
|
- If a trait A exists in 10% of a population of an asexually reproducing...
Text Solution
|
- If a trait 'A' exists in 10% of a population of an asexually reproduci...
Text Solution
|
- The graph above shows how the size of a country's population has chang...
Text Solution
|
- The following graph shows the range of variation among population memb...
Text Solution
|
- If trait A exists in 10% of a population of an asexually reproducing s...
Text Solution
|