नीचे दिया हुआ दंड आलेख वर्ष `1998-2002` में सरकार द्वारा खरीदे गए गेहु की मात्रा दर्शाता है :
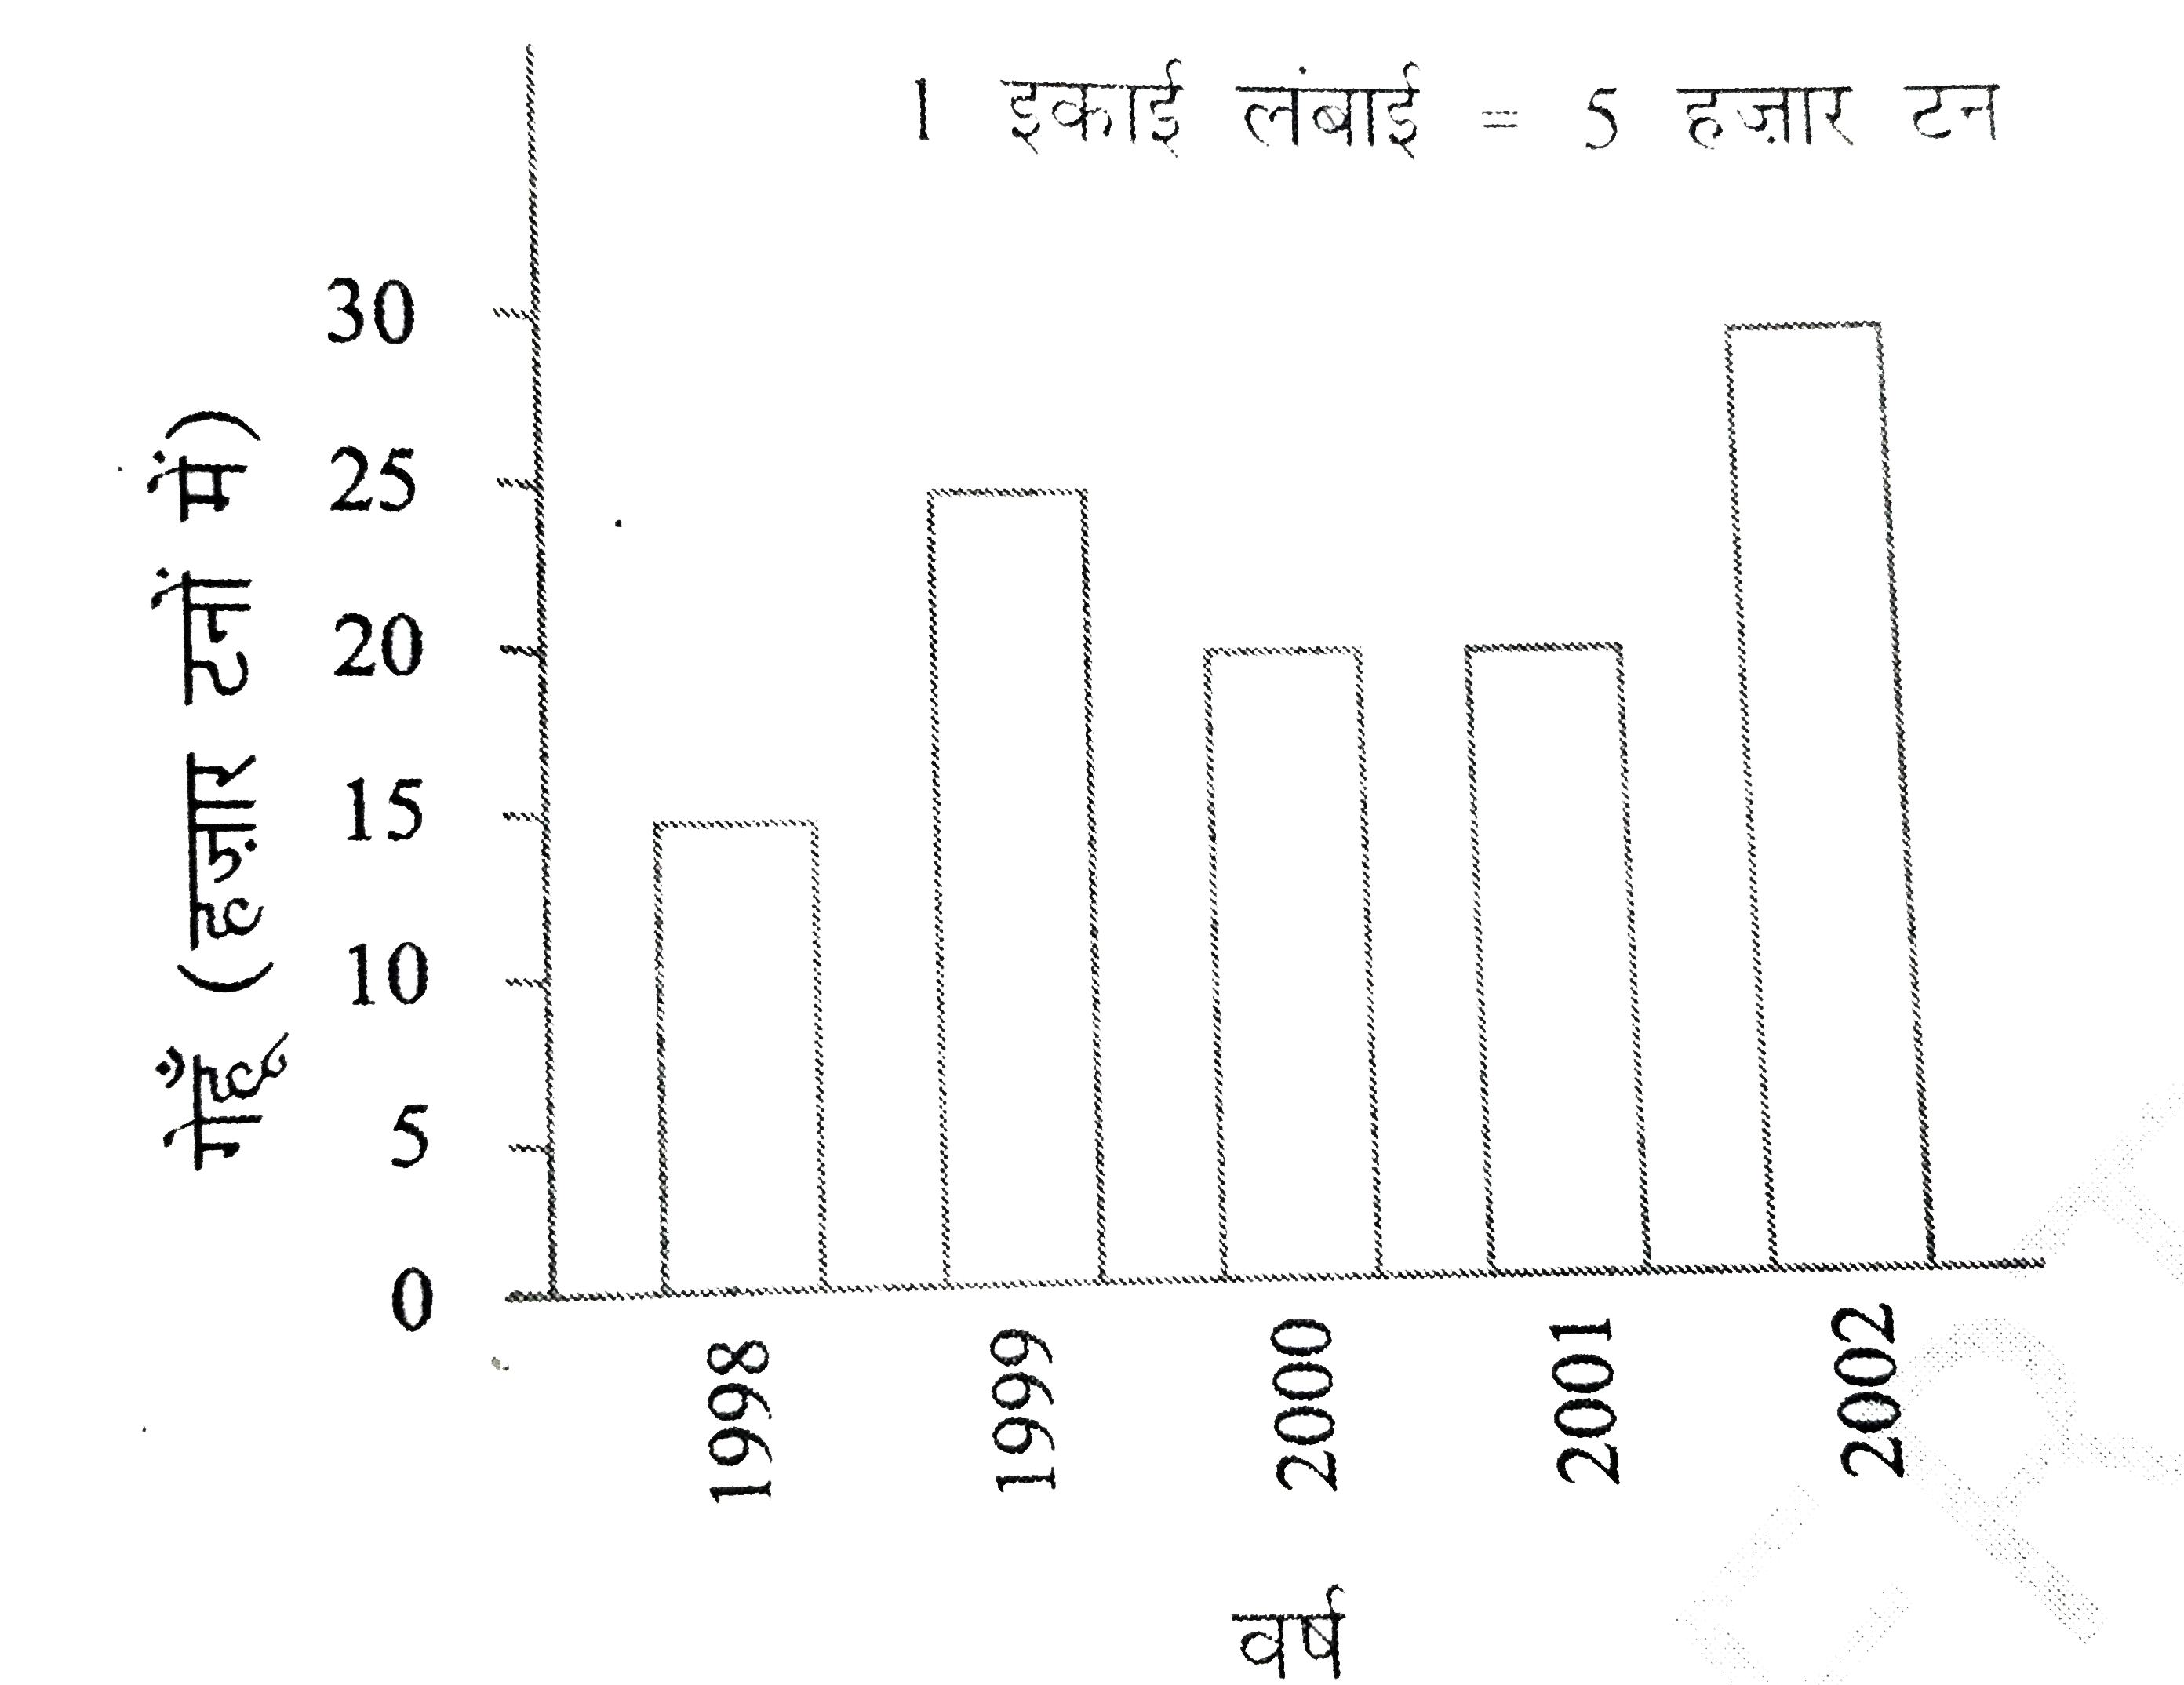
इस दंड आलेख को पढ़िए और अपने प्रेक्षणो को लिखिए ।
(a) किस वर्ष में गेहू का अधिकतम उत्पादन हुआ ?
(b) किस वर्ष में गेहू का न्यूनतम उत्पादन हुआ ?
नीचे दिया हुआ दंड आलेख वर्ष `1998-2002` में सरकार द्वारा खरीदे गए गेहु की मात्रा दर्शाता है :
इस दंड आलेख को पढ़िए और अपने प्रेक्षणो को लिखिए ।
(a) किस वर्ष में गेहू का अधिकतम उत्पादन हुआ ?
(b) किस वर्ष में गेहू का न्यूनतम उत्पादन हुआ ?
इस दंड आलेख को पढ़िए और अपने प्रेक्षणो को लिखिए ।
(a) किस वर्ष में गेहू का अधिकतम उत्पादन हुआ ?
(b) किस वर्ष में गेहू का न्यूनतम उत्पादन हुआ ?


Similar Questions
Explore conceptually related problems
The bar graph given below shows the target and actual production of cement ( in thousand tons ) during 2013-2017. Out of given 5 years, in which years the target production of the cement was 45% more than the average actual production ? नीचे दिया गया दंड आरेख 2013-2017 के दौरान सीमेंट के लक्षित और वास्तविक उत्पादन (हजार टन में) को दर्शाता है | दिए गए 5 वर्षों में से किन वर्षों में सीमेंट का लक्षित उत्पादन, सीमेंट के औसत वास्तविक उत्पादन से 45% अधिक था ?
The bar graph given below shows the target and actual production of cement ( in thousand tons ) during 2013-2017. What percentage of the total targeted production of cement from 2013 to 2017 is the total actual production in 2014, 2015 and 2017? ( correct to one decimal place ) नीचे दिया गया दंड आरेख 2013-2017 के दौरान सीमेंट के लक्षित और वास्तविक उत्पादन (हजार टन में) को दर्शाता है | 2013 से 2017 तक सीमेंट के कुल लक्षित उत्पादन का कितना प्रतिशत, 2014, 2015 और 2017 में कुल वास्तविक उत्पादन है ? (दशमलव के एक स्थान तक)
The bar graph given below shows the wheat production (in tonnes) of a large farm during the year 2011-2018. In how many years was wheat production higher than the average production of the period? नीचे दिए गए दंड आरेख में वर्ष 2011-2018 के दौरान किसी बड़े फार्म के गेहूं उत्पादन (टन में) को दर्शाया गया है | अवधि के औसत उत्पादन की तुलना में दिए गए कितने वर्षो में गेहूं उत्पादन अधिक था ?
The bar graph given below shows the target and actual production of cement ( in thousand tons ) during 2013-2017. The ratio of the target production in 2014 and 2016 to the actual total production in 2013, 2016 and 2017 is : नीचे दिया गया दंड आरेख 2013-2017 के दौरान सीमेंट के लक्षित और वास्तविक उत्पादन (हजार टन में) को दर्शाता है | वर्ष 2014 और 2016 में सीमेंट के कुल लक्षित उत्पादन और 2013, 2016 तथा 2017 में कुल वास्तविक उत्पादन का अनुपात है :
नीचे दिया गया दण्ड आलेख वर्ष 1993 में एक परिवार की आय का विभिन्न मदों पर व्यय एवं बचत को दर्शाता है। आलेख का ध्यानपूर्वक अवलोकन कीजिए तथा उत्तर दीजिए: 1993 में व्यय की गयी पारिवारिक आय (प्रतिशत में) Percentage of expenditure on cloths is how much more than saving percentage ? कपड़े पर व्यय का प्रतिशत, बचत प्रतिशत से कितना अधिक है?
The following line diagram represents the yearly sales figure of a company in the years 2001-2010. Examine the diagram and answer the question. निम्नलिखित रेखा आरेख किसी कंपनी की वर्ष 2007-2010 के दौरान वार्षिक बिक्री के आंकड़ों को दर्शाता है। आरेख का अध्ययन करें और नीचे दिए गए प्रश्नों के उत्तर दें- The ratio of sales in 2002 to that in 2007 is वर्ष 2002 में बिक्री का वर्ष 2007 में बिक्री के साथ अनुपात है-
नीचे दिया गया दण्ड आलेख वर्ष 1993 में एक परिवार की आय का विभिन्न मदों पर व्यय एवं बचत को दर्शाता है। आलेख का ध्यानपूर्वक अवलोकन कीजिए तथा उत्तर दीजिए: 1993 में व्यय की गयी पारिवारिक आय (प्रतिशत में) Expenditure on food is how much percent more than expenditure on others ? भोजन पर किया गया व्यय अन्य से कितना प्रतिशत अधिक है?
नीचे दिया गया दण्ड आलेख वर्ष 1993 में एक परिवार की आय का विभिन्न मदों पर व्यय एवं बचत को दर्शाता है। आलेख का ध्यानपूर्वक अवलोकन कीजिए तथा उत्तर दीजिए: 1993 में व्यय की गयी पारिवारिक आय (प्रतिशत में) If in 1993 total income of family was ₹ 1,00,000, then what was total saving of family in 1993 ? यदि वर्ष 1993 में परिवार की कुल आय ₹ 1,00,000 थी, तो 1993 में परिवार की कुल बचत थी -
The given Bar Graph presents the results in terms of the number of students in a school for the five academic years, 2013-2014 to 2017-2018. In which year the percentage increase in total number of students is the lowest in comparison to its previous academic year? दिया गया दंड आरेख पांच शैक्षणिक वर्षों : 2013-2014 से 2017-2018 तक एक विद्यालय में छात्रों की संख्या के संदर्भ में परिणामों को प्रस्तुत करता है | किस वर्ष छात्रों की कुल संख्या में प्रतिशत वृद्धि पिछले शैक्षणिक वर्ष की तुलना में सबसे कम है ?
The given Bar Graph presents the number of students of two schools for six years. दिया गया दंड आरेख छः वर्ष की अवधि में दो विद्यालयों में छात्रों की संख्या को दर्शाता है | In which year, the absolute difference of the students in two schools is the lowest? किस वर्ष में, दोनों विद्यालयों के छात्रों में पूर्ण अंतर सबसे कम है ?
Recommended Questions
- नीचे दिया हुआ दंड आलेख वर्ष 1998-2002 में सरकार द्वारा खरीदे गए गेहु ...
Text Solution
|
- ज्योतिबा फुले' का विवाह किस वर्ष हुआ ?
Text Solution
|
- सूरदास की रचनाओं में किस भाषा का प्रयोग हुआ है?
Text Solution
|
- महादेवी वर्मा का जन्म किस वर्ष हुआ था ?
Text Solution
|
- नरेन्द्र शर्मा का जन्म किस वर्ष हुआ था ?
Text Solution
|
- श्रीकांत वर्मा का जन्म किस वर्ष हुआ ?
Text Solution
|
- धूमिल का जन्म किस वर्ष हुआ था ?
Text Solution
|
- किस शब्द में अव उपसर्ग का प्रयोग नहीं हुआ है ?
Text Solution
|
- The given Bar Graph presents the number of students of two schools for...
Text Solution
|