


Similar Questions
Explore conceptually related problems
Recommended Questions
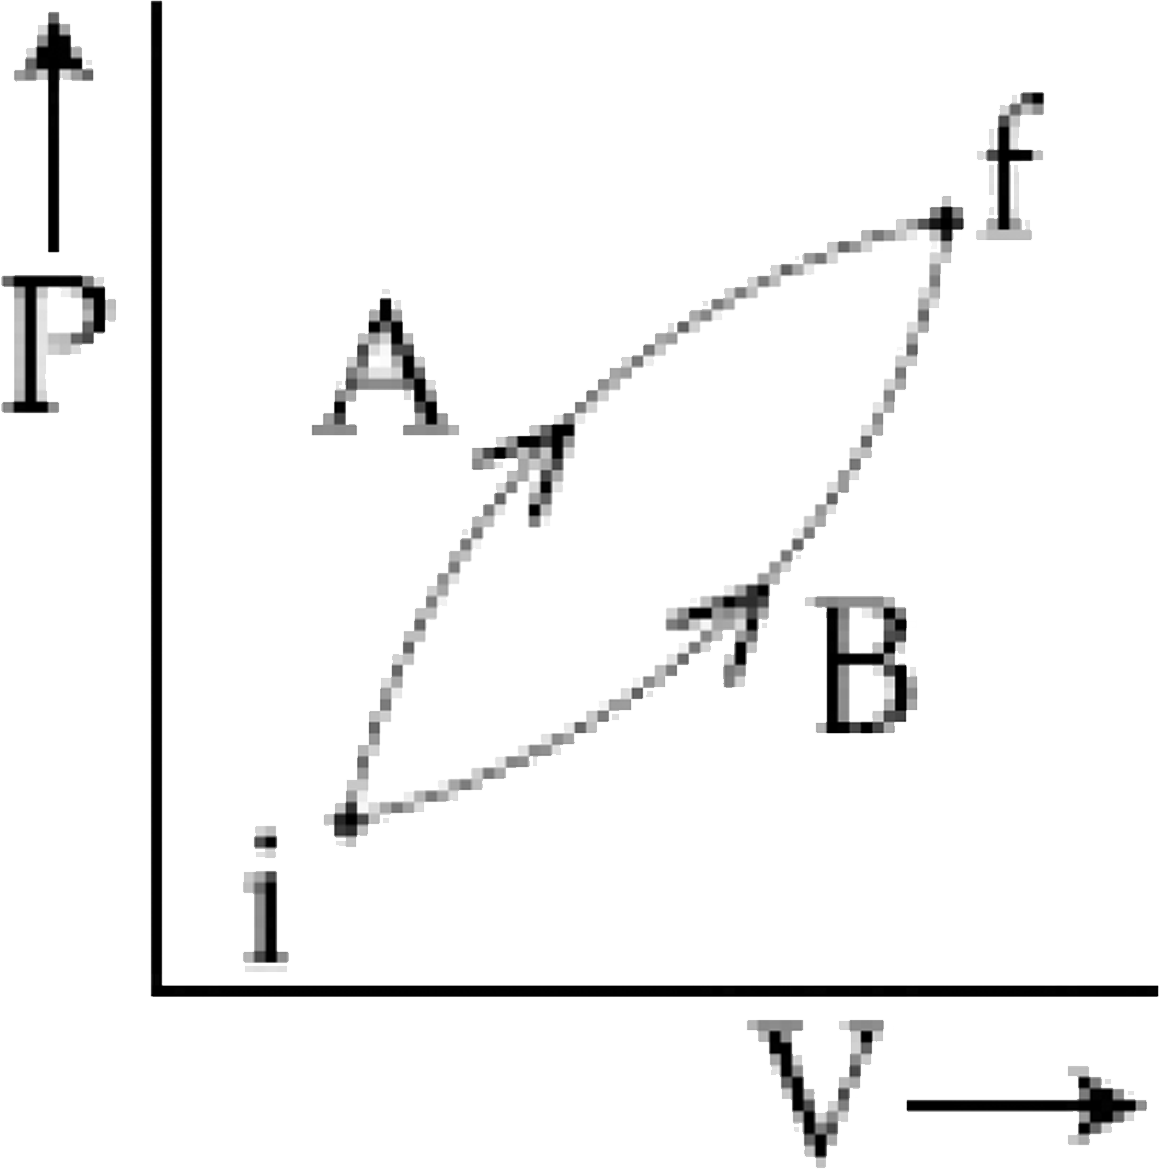
- Following figure shows two process A and B for a gas. If Delta Q(A) an...
Text Solution
|
- Following figure shows two process A and B for a gas. If Delta Q(A) an...
Text Solution
|
- Which of the following expressions is not acceptable? (i) Delta P = ...
Text Solution
|
- In given figure, let Delta W and Delta W(2) be the work done by the ga...
Text Solution
|
- Let Delta U(1) and Delta U(2) be the changes in internal energy of an ...
Text Solution
|
- An ideal gas undergoes a cyclic process as shown in figure delta U(BC)...
Text Solution
|
- A system can go from state A to state B in two different processes 1 a...
Text Solution
|
- In figure, three isothermal processes are shown for the same gas and f...
Text Solution
|
- दिये गये चित्र में दो प्रक्रियाओं A व B को एक गैस के लिये दिखाया है। य...
Text Solution
|