


Similar Questions
Explore conceptually related problems
Recommended Questions
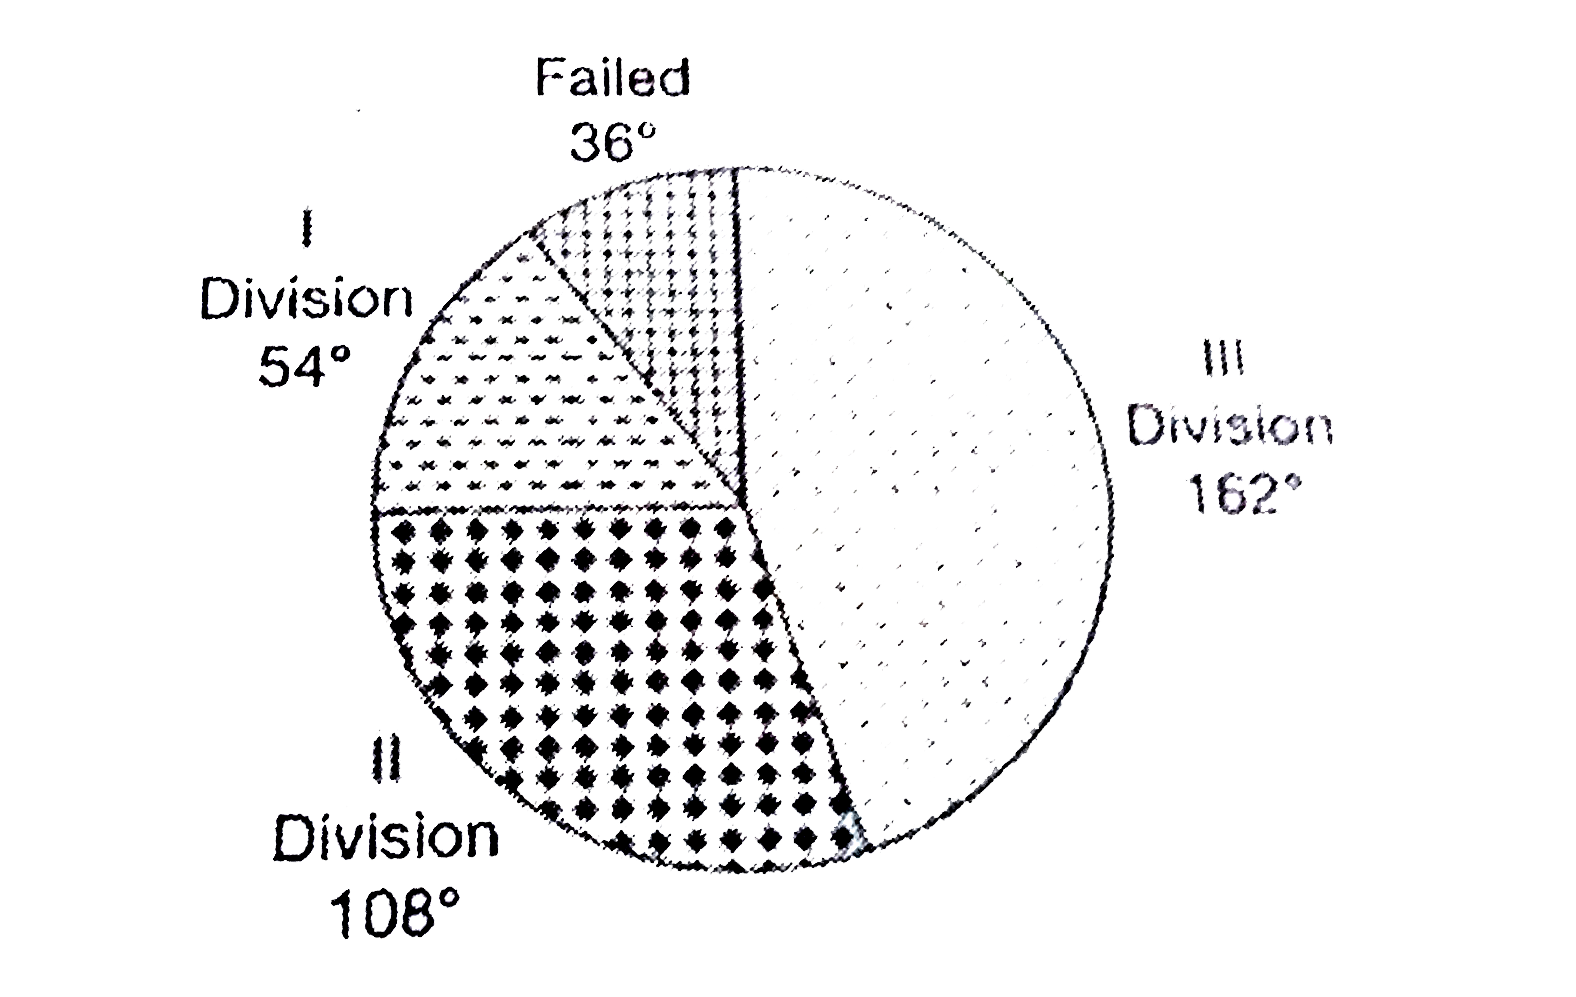
- The performance of 720 students in an examination for the academic yea...
Text Solution
|
- The performance of 720 students in an examination for the academic yea...
Text Solution
|
- Match the following Column A to Column B
Text Solution
|
- For shown situation find angleBCA :- ltimg src="https://d10lpgp6xz60...
Text Solution
|
- Find the magnitude of the resultant of shown forces :- ltimg src="ht...
Text Solution
|
- The following pie chart shows the performance in an examination in a p...
Text Solution
|
- The following pie chart shows the performance in an examination in a p...
Text Solution
|
- The following pie chart shows the performance in an examination in a p...
Text Solution
|
- The following pie chart shows the performance in an examination in a p...
Text Solution
|