


Similar Questions
Explore conceptually related problems
Recommended Questions
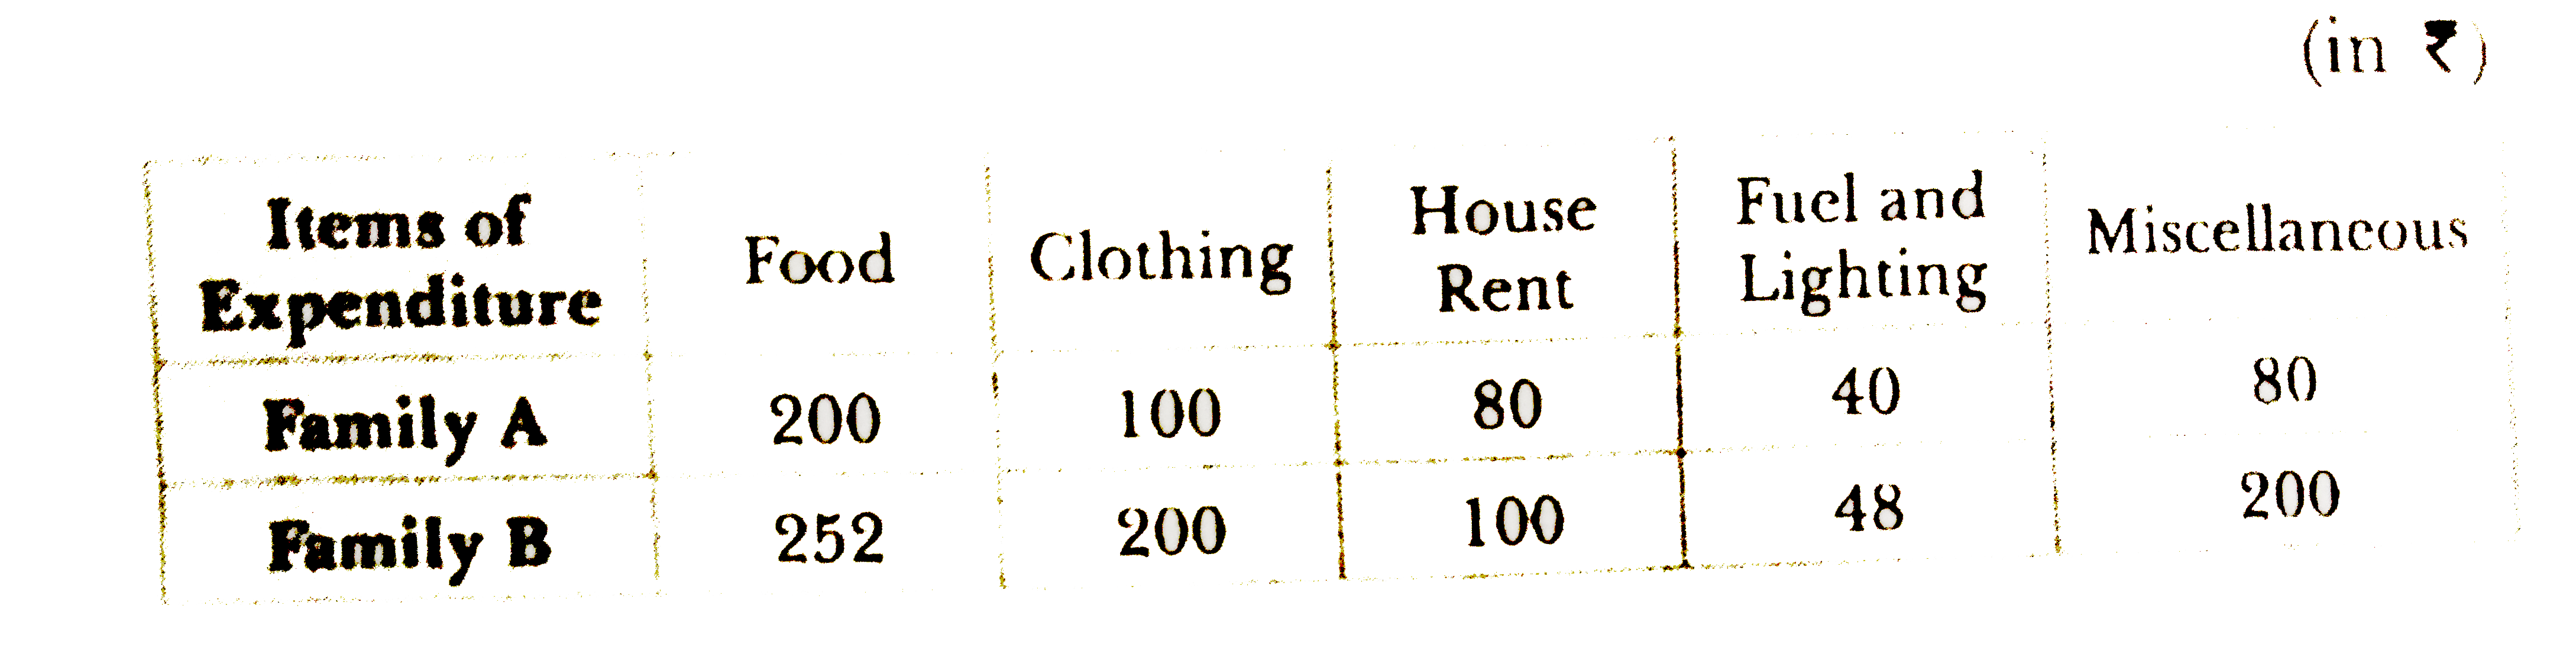
- Represent the following data, using a percentage bar diagram :
Text Solution
|
- सूत्र C(4) H(11) N में कितने प्रतिशत ऐमिन संभव है?
Text Solution
|
- जैव-विकास को अवशेषी अंग किस प्रकार परमानित करते है?
Text Solution
|
- चित्रानुसार एक दण्ड चुम्बक मुक्त रूप से एक कुण्डली के बीच से होकर गिरत...
Text Solution
|
- प्रत्यावर्ती धरा जनित्र का सिद्धांत तथा कार्यप्रणाली चित्र द्वारा समझा...
Text Solution
|
- वाटहीन धारा का एक परिपथ आरेख खीचिए।
Text Solution
|
- k के किस मान के लिये , निम्नलिखित समीकरण निकाय समपाती रेखाओ को प्...
Text Solution
|
- अन्त: केंद्रित घनीय इकाई सेल में रिक्त स्थान का प्रतिशत है :
Text Solution
|
- घनीय बंद संकुलन (ccp) तथा केंद्रित घनीय बंद संकुलन (bcc) में रिक्त स्थ...
Text Solution
|