


Similar Questions
Explore conceptually related problems
Recommended Questions
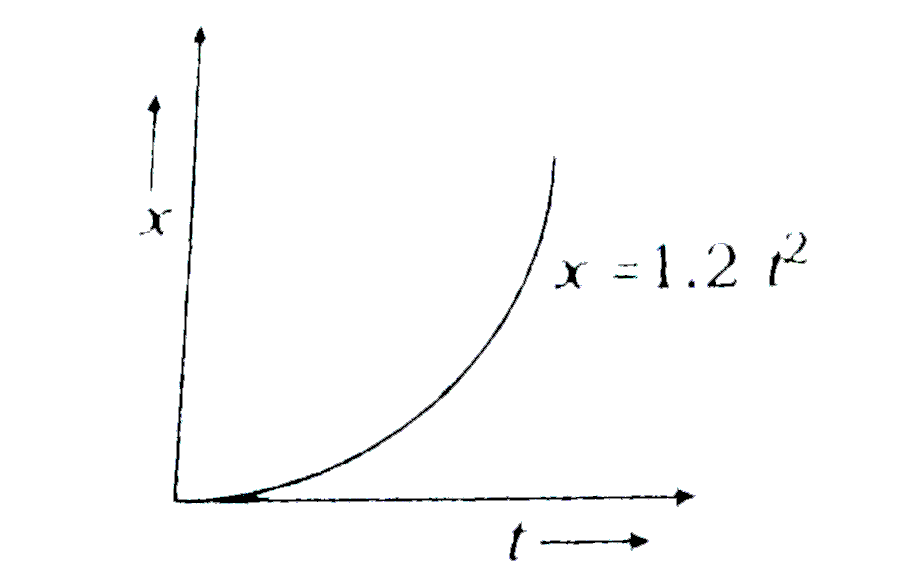
- Figure given shows the distance - time graph of the motion of a car. I...
Text Solution
|
- Figure given shows the distance - time graph of the motion of a car. I...
Text Solution
|
- निम्नांकित चित्र में एक कार का समय-वेग ग्राफ प्रदर्शित है । ग्राफ से ...
Text Solution
|
- In the above figure distance vs time graphs showing motion of two cars...
Text Solution
|
- In the above figure distance vs time graphs showing motion of two car...
Text Solution
|
- Speed - time graph for a car is show in the fig 1.13:Which part of the...
Text Solution
|
- Given figure shows the distance-time graph of the motion of a car. It ...
Text Solution
|
- The velocity time graph of the motion of a car is given here.
Text Solution
|
- Figure below shows the distance -time graph of the motion of a car. It...
Text Solution
|