


Similar Questions
Explore conceptually related problems
Recommended Questions
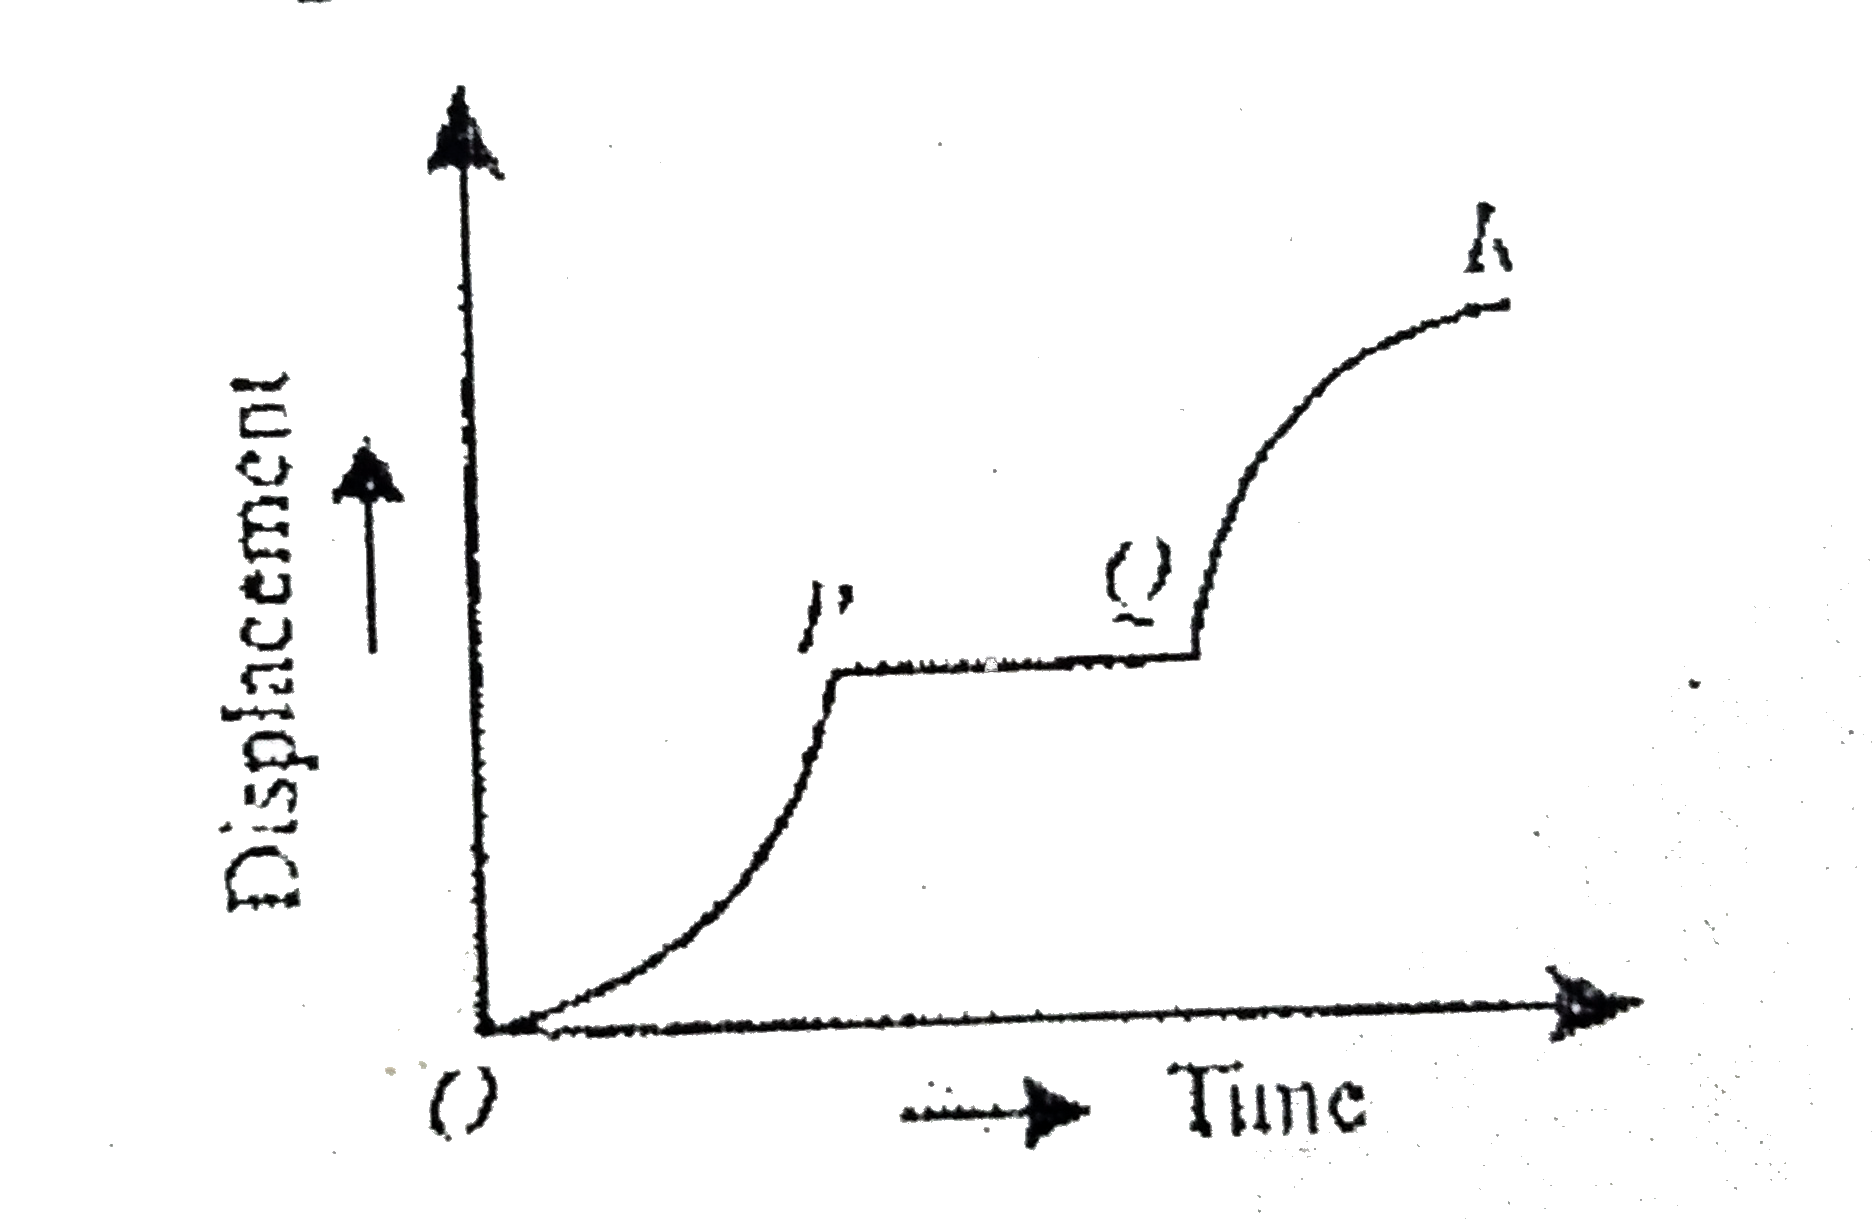
- The distplcement time graph of a prticle moving alon a staraingt line ...
Text Solution
|
- Take any point O in the interior of a triangle PQR. Is (i) OP+OQ > P...
Text Solution
|
- The acceleration-time graph of a patticle moving in a straight line is...
Text Solution
|
- The velocity-time graph of a body moving in a straight line is shown b...
Text Solution
|
- A particle is moving in a straight line according to graph given below...
Text Solution
|
- The distplcement time graph of a prticle moving alon a staraingt line ...
Text Solution
|
- एक वस्तु एक सरल रेखा में एकसमान त्वरण से चल रही है । इसका वेग-समय ग्रा...
Text Solution
|
- Displacement-time graph of a particle moving in a straight line is as ...
Text Solution
|
- एक सरल रेखा में गति करते हुए कण का विस्थापन-समय ग्राफ चित्र में दर्शाय...
Text Solution
|