Text Solution
Verified by Experts


Topper's Solved these Questions
ELECTRIC CHARGES AND FIELDS
KUMAR PRAKASHAN|Exercise SECTION B NUMERICALS (NUMERICAL FOR .DARPAN. BASED ON TEXTBOOK)|8 VideosELECTRIC CHARGES AND FIELDS
KUMAR PRAKASHAN|Exercise SECTION C NCERT EXEMPLAR SOLUTION (MULTIPLE CHOICE QUESTIONS (MCQs))|7 VideosELECTRIC CHARGES AND FIELDS
KUMAR PRAKASHAN|Exercise SECTION B NUMERICALS (NUMERICAL FROM TEXTUAL EXERCISES)|24 VideosDUAL NATURE OF RADIATION AND MATTER
KUMAR PRAKASHAN|Exercise Section-D (MCQs asked in GUJCET/Board Exam)|1 VideosELECTROMAGNETIC INDUCTION
KUMAR PRAKASHAN|Exercise Section D MCQs (MCQs asked in Competitive Exams )|38 Videos
Similar Questions
Explore conceptually related problems
KUMAR PRAKASHAN-ELECTRIC CHARGES AND FIELDS -SECTION B NUMERICALS (ADDITONAL EXERCISE)
- An oil drop of 12 excess electrons is held stationary under a constant...
Text Solution
|
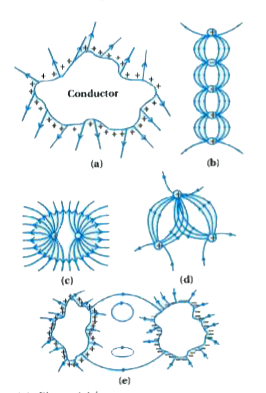
- Which among the curves shown in figure cannot possibly represent elect...
Text Solution
|
- In a certain region of space, electric field is along the z-direction ...
Text Solution
|
- (a) A conductor A with a cavity as shown in figure (a) is given a char...
Text Solution
|
- A hollow charged conductor has a tiny hole cut into its surface. Show ...
Text Solution
|
- Obtain the formula for the electric field due to a long thin wire of u...
Text Solution
|
- It is now believed that protons and neutrons (which constitute nuclei ...
Text Solution
|
- (a) Consider an arbitrary electrostatic field configuration. A small t...
Text Solution
|
- A particle of mass m and charge (-q) enters the region between the two...
Text Solution
|
- Suppose that the particle in Exercise in 1.33 is an electron projected...
Text Solution
|