


Similar Questions
Explore conceptually related problems
Recommended Questions
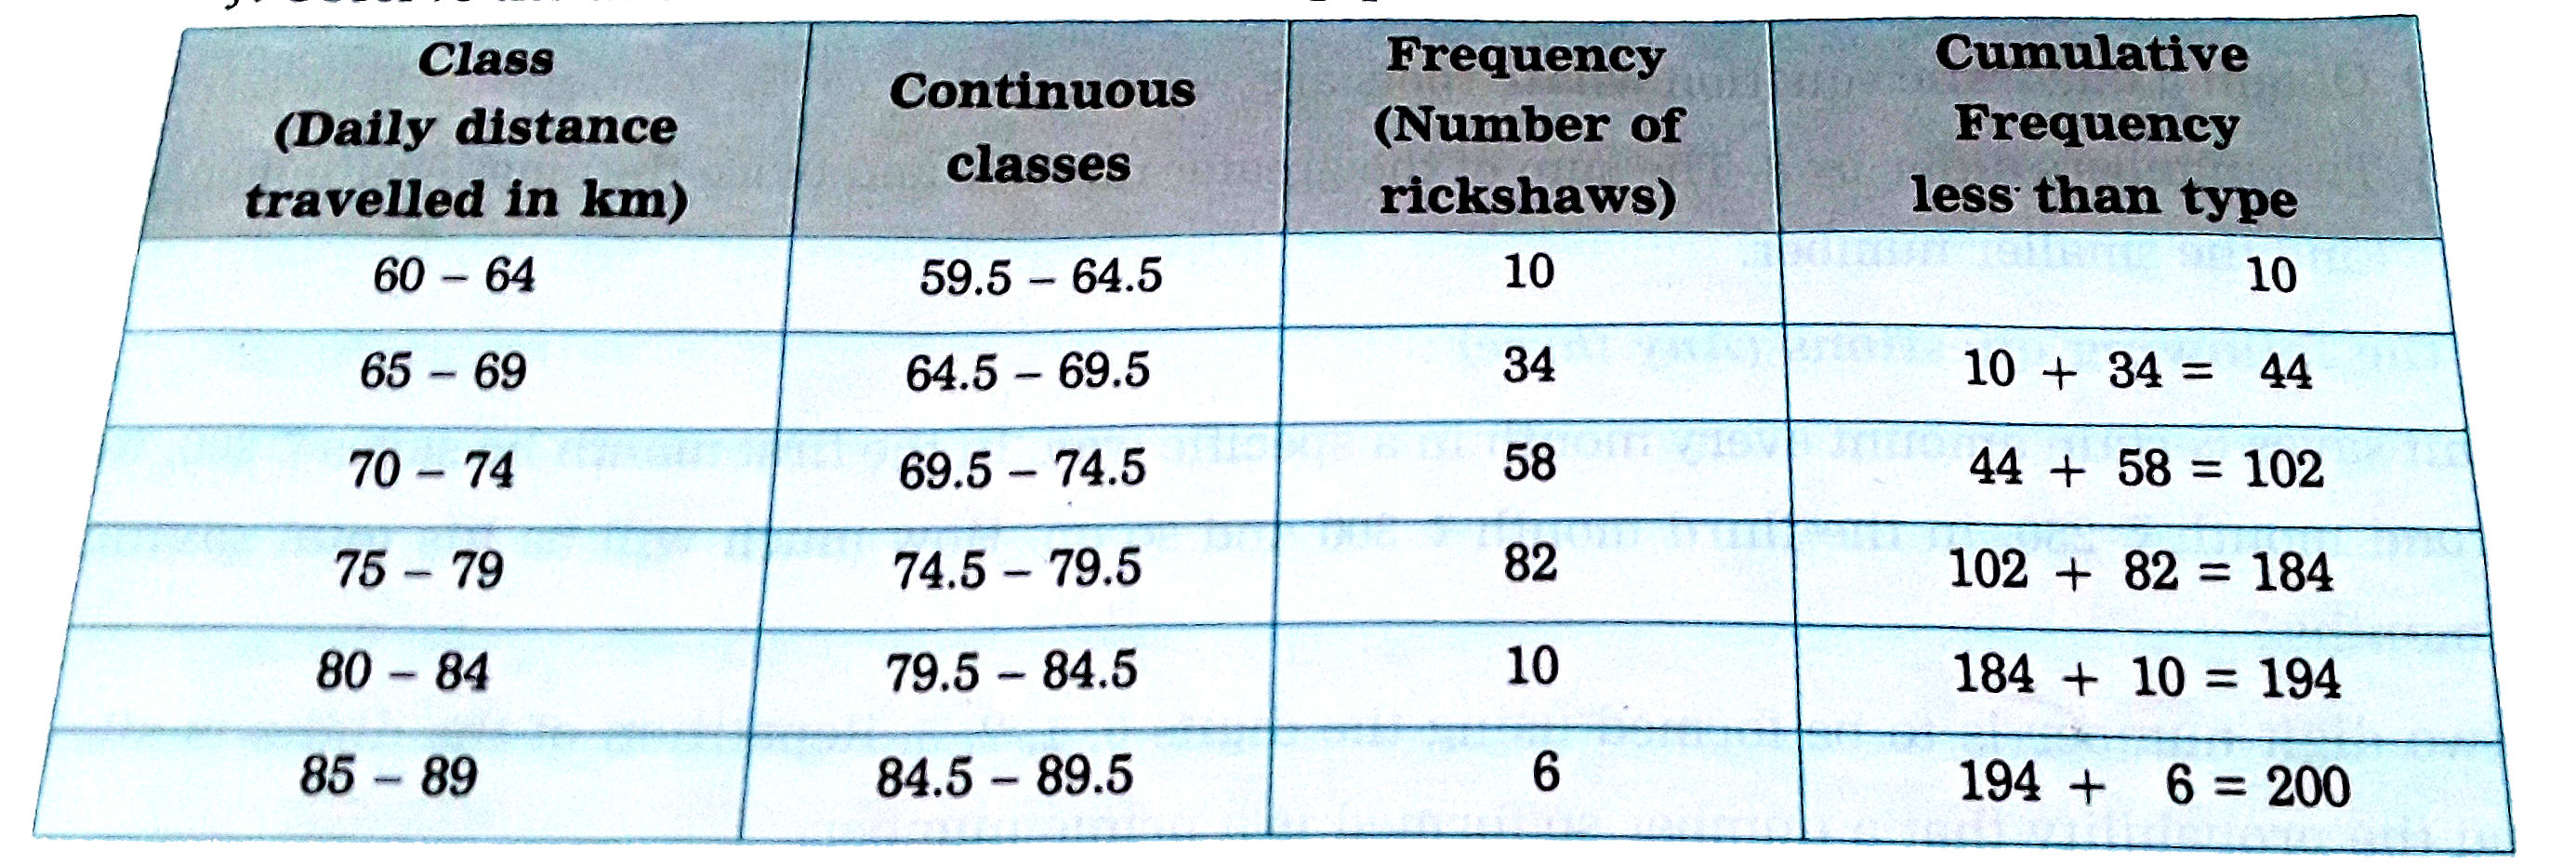
- The following frequency distribution table shows the distances tr...
Text Solution
|
- While calculating mode the following observation are found. Lower lim...
Text Solution
|
- Determine the point of symmetry of a regular hexagon. <img src="htt...
Text Solution
|
- Match the following Column A to Column B
Text Solution
|
- The inequation represented by the graph given below is : <img src="htt...
Text Solution
|
- The inequation that best describes the graph given below is <img src=...
Text Solution
|
- The inequation that best describes the following graph is <img src="h...
Text Solution
|
- In the given figure, PQRS is a parallelogram. A and B are the mid-poin...
Text Solution
|
- Cl ,Br , I , या हैलोजन आवर्त सारणी के किस वर्ग के सदस्य है ?
Text Solution
|