


Similar Questions
Explore conceptually related problems
Recommended Questions
- निम्न वृत्त -चित्र एक अभ्यर्थी द्वारा प्रदूषण जांच अभियान के द्वारा वि...
Text Solution
|
- निचे दिये गये ग्राफ में दो प्रकार के वाहनों A व B के छ वर्षो के प्रद...
Text Solution
|
- निचे दिये गये ग्राफ में दो प्रकार के वाहनों A व B के छ वर्षो के प्रद...
Text Solution
|
- निचे दिये गये ग्राफ में दो प्रकार के वाहनों A व B के छ वर्षो के प्रद...
Text Solution
|
- निचे दिये गये ग्राफ में दो प्रकार के वाहनों A व B के छ वर्षो के प्रद...
Text Solution
|
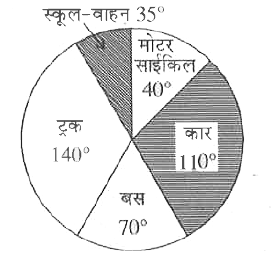
- चित्र में दिया गया वृत्त चार्ट मई -जून 2013 के दौरान वाहनों का केन्...
Text Solution
|
- चित्र में दिया गया वृत्त चार्ट मई -जून 2013 के दौरान वाहनों का केन्...
Text Solution
|
- निम्न वृत्त -चित्र एक अभ्यर्थी द्वारा प्रदूषण जांच अभियान के द्वारा वि...
Text Solution
|
- निम्न वृत्त -चित्र एक अभ्यर्थी द्वारा प्रदूषण जांच अभियान के द्वारा वि...
Text Solution
|